Scottish vs Venezuelan Householder Income Under 25 years
COMPARE
Scottish
Venezuelan
Householder Income Under 25 years
Householder Income Under 25 years Comparison
Scottish
Venezuelans
$50,554
HOUSEHOLDER INCOME UNDER 25 YEARS
1.8/ 100
METRIC RATING
249th/ 347
METRIC RANK
$50,011
HOUSEHOLDER INCOME UNDER 25 YEARS
0.5/ 100
METRIC RATING
268th/ 347
METRIC RANK
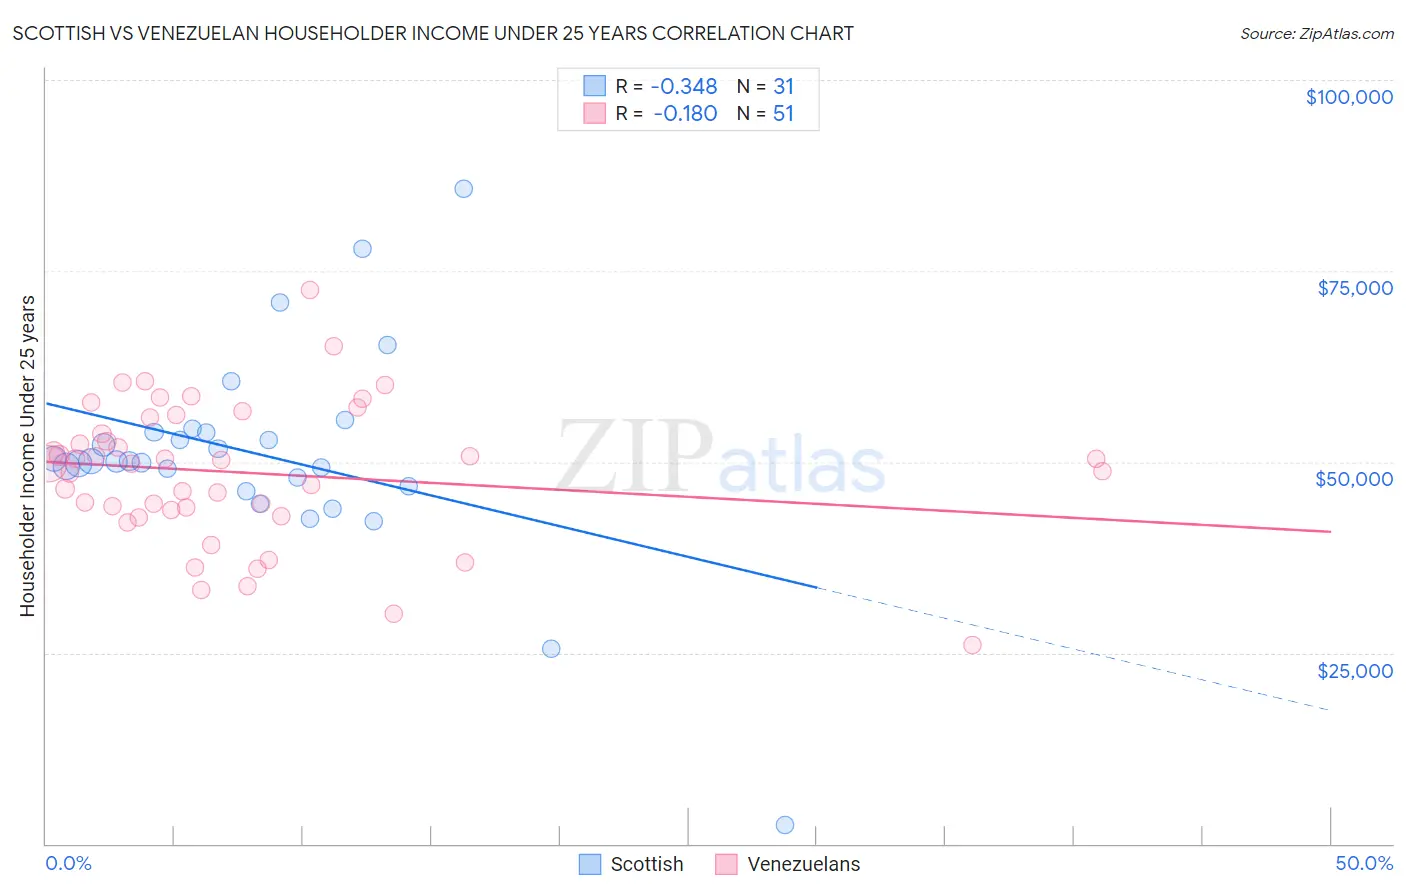
Scottish vs Venezuelan Householder Income Under 25 years Correlation Chart
The statistical analysis conducted on geographies consisting of 436,394,283 people shows a mild negative correlation between the proportion of Scottish and household income with householder under the age of 25 in the United States with a correlation coefficient (R) of -0.348 and weighted average of $50,554. Similarly, the statistical analysis conducted on geographies consisting of 267,458,275 people shows a poor negative correlation between the proportion of Venezuelans and household income with householder under the age of 25 in the United States with a correlation coefficient (R) of -0.180 and weighted average of $50,011, a difference of 1.1%.
Householder Income Under 25 years Correlation Summary
| Measurement | Scottish | Venezuelan |
| Minimum | $2,499 | $26,011 |
| Maximum | $85,781 | $72,500 |
| Range | $83,282 | $46,489 |
| Mean | $50,902 | $48,579 |
| Median | $50,084 | $49,832 |
| Interquartile 25% (IQ1) | $46,875 | $43,664 |
| Interquartile 75% (IQ3) | $53,902 | $55,823 |
| Interquartile Range (IQR) | $7,027 | $12,159 |
| Standard Deviation (Sample) | $14,135 | $9,174 |
| Standard Deviation (Population) | $13,905 | $9,084 |
Demographics Similar to Scottish and Venezuelans by Householder Income Under 25 years
In terms of householder income under 25 years, the demographic groups most similar to Scottish are Slavic ($50,563, a difference of 0.020%), Immigrants from Cabo Verde ($50,520, a difference of 0.070%), Celtic ($50,447, a difference of 0.21%), Immigrants from Mexico ($50,422, a difference of 0.26%), and Immigrants from Haiti ($50,398, a difference of 0.31%). Similarly, the demographic groups most similar to Venezuelans are Immigrants from Laos ($50,041, a difference of 0.060%), Immigrants from Venezuela ($50,109, a difference of 0.19%), Belgian ($50,113, a difference of 0.20%), Fijian ($50,132, a difference of 0.24%), and Immigrants from Dominican Republic ($50,204, a difference of 0.39%).
| Demographics | Rating | Rank | Householder Income Under 25 years |
| Slavs | 1.8 /100 | #248 | Tragic $50,563 |
| Scottish | 1.8 /100 | #249 | Tragic $50,554 |
| Immigrants | Cabo Verde | 1.7 /100 | #250 | Tragic $50,520 |
| Celtics | 1.4 /100 | #251 | Tragic $50,447 |
| Immigrants | Mexico | 1.3 /100 | #252 | Tragic $50,422 |
| Immigrants | Haiti | 1.2 /100 | #253 | Tragic $50,398 |
| Luxembourgers | 1.2 /100 | #254 | Tragic $50,379 |
| Aleuts | 1.2 /100 | #255 | Tragic $50,377 |
| Immigrants | Cuba | 1.2 /100 | #256 | Tragic $50,374 |
| Lebanese | 1.1 /100 | #257 | Tragic $50,355 |
| Whites/Caucasians | 1.1 /100 | #258 | Tragic $50,336 |
| Immigrants | Dominica | 1.0 /100 | #259 | Tragic $50,301 |
| Hispanics or Latinos | 0.9 /100 | #260 | Tragic $50,279 |
| Hungarians | 0.9 /100 | #261 | Tragic $50,247 |
| Haitians | 0.8 /100 | #262 | Tragic $50,231 |
| Immigrants | Dominican Republic | 0.8 /100 | #263 | Tragic $50,204 |
| Fijians | 0.6 /100 | #264 | Tragic $50,132 |
| Belgians | 0.6 /100 | #265 | Tragic $50,113 |
| Immigrants | Venezuela | 0.6 /100 | #266 | Tragic $50,109 |
| Immigrants | Laos | 0.5 /100 | #267 | Tragic $50,041 |
| Venezuelans | 0.5 /100 | #268 | Tragic $50,011 |