Apache vs Venezuelan Householder Income Under 25 years
COMPARE
Apache
Venezuelan
Householder Income Under 25 years
Householder Income Under 25 years Comparison
Apache
Venezuelans
$49,395
HOUSEHOLDER INCOME UNDER 25 YEARS
0.1/ 100
METRIC RATING
279th/ 347
METRIC RANK
$50,011
HOUSEHOLDER INCOME UNDER 25 YEARS
0.5/ 100
METRIC RATING
268th/ 347
METRIC RANK
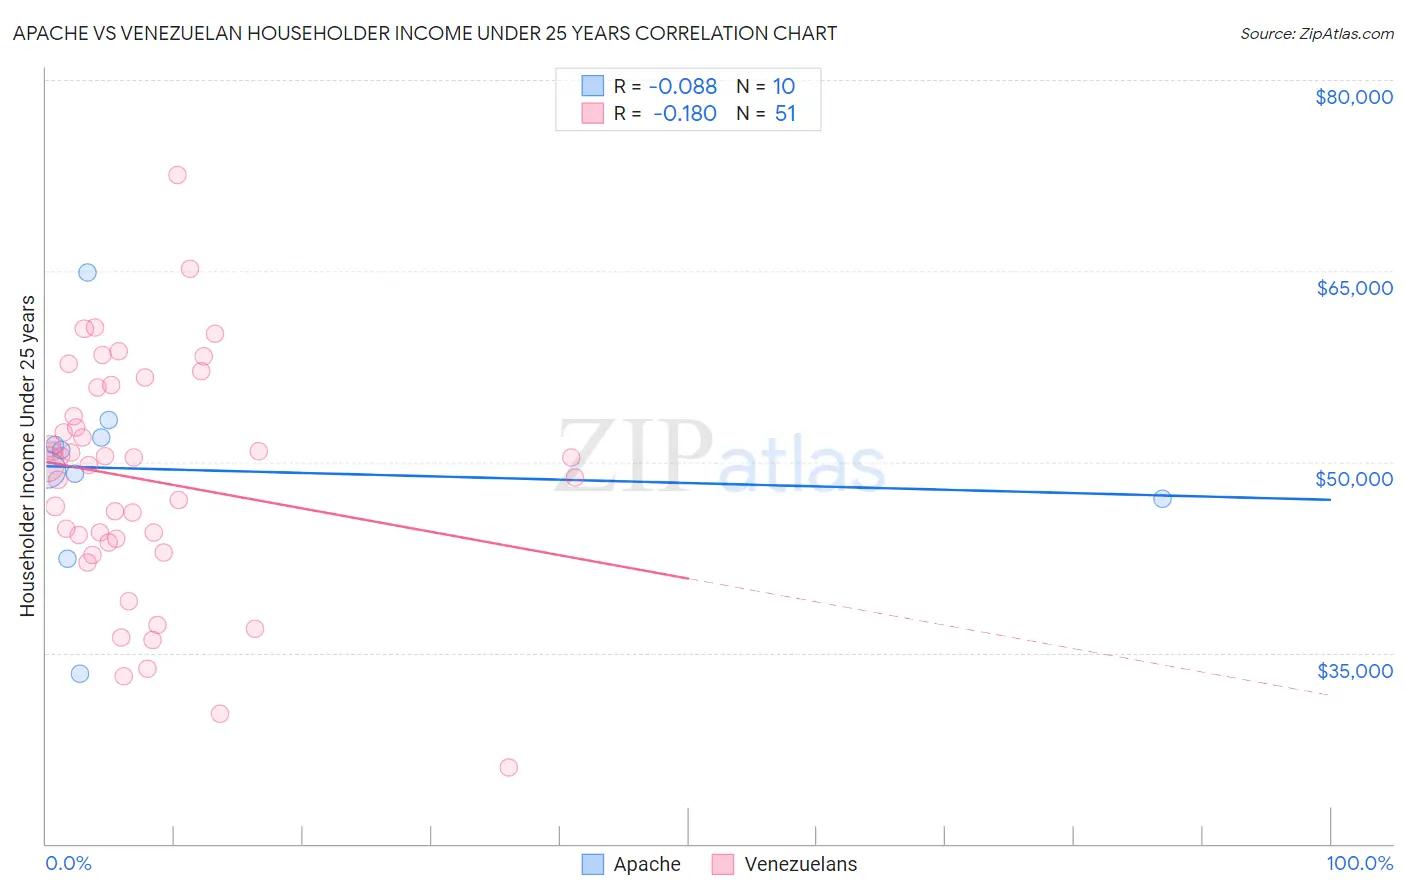
Apache vs Venezuelan Householder Income Under 25 years Correlation Chart
The statistical analysis conducted on geographies consisting of 208,884,010 people shows a slight negative correlation between the proportion of Apache and household income with householder under the age of 25 in the United States with a correlation coefficient (R) of -0.088 and weighted average of $49,395. Similarly, the statistical analysis conducted on geographies consisting of 267,458,275 people shows a poor negative correlation between the proportion of Venezuelans and household income with householder under the age of 25 in the United States with a correlation coefficient (R) of -0.180 and weighted average of $50,011, a difference of 1.3%.
Householder Income Under 25 years Correlation Summary
| Measurement | Apache | Venezuelan |
| Minimum | $33,347 | $26,011 |
| Maximum | $64,911 | $72,500 |
| Range | $31,564 | $46,489 |
| Mean | $49,372 | $48,579 |
| Median | $50,154 | $49,832 |
| Interquartile 25% (IQ1) | $47,083 | $43,664 |
| Interquartile 75% (IQ3) | $51,895 | $55,823 |
| Interquartile Range (IQR) | $4,812 | $12,159 |
| Standard Deviation (Sample) | $8,028 | $9,174 |
| Standard Deviation (Population) | $7,616 | $9,084 |
Demographics Similar to Apache and Venezuelans by Householder Income Under 25 years
In terms of householder income under 25 years, the demographic groups most similar to Apache are Nigerian ($49,416, a difference of 0.040%), Hmong ($49,364, a difference of 0.060%), Nonimmigrants ($49,348, a difference of 0.090%), Alsatian ($49,267, a difference of 0.26%), and Immigrants from Nigeria ($49,174, a difference of 0.45%). Similarly, the demographic groups most similar to Venezuelans are Ute ($49,997, a difference of 0.030%), Mexican ($49,989, a difference of 0.040%), Immigrants from Laos ($50,041, a difference of 0.060%), Immigrants from Venezuela ($50,109, a difference of 0.19%), and Belgian ($50,113, a difference of 0.20%).
| Demographics | Rating | Rank | Householder Income Under 25 years |
| Immigrants | Dominican Republic | 0.8 /100 | #263 | Tragic $50,204 |
| Fijians | 0.6 /100 | #264 | Tragic $50,132 |
| Belgians | 0.6 /100 | #265 | Tragic $50,113 |
| Immigrants | Venezuela | 0.6 /100 | #266 | Tragic $50,109 |
| Immigrants | Laos | 0.5 /100 | #267 | Tragic $50,041 |
| Venezuelans | 0.5 /100 | #268 | Tragic $50,011 |
| Ute | 0.5 /100 | #269 | Tragic $49,997 |
| Mexicans | 0.5 /100 | #270 | Tragic $49,989 |
| Taiwanese | 0.3 /100 | #271 | Tragic $49,804 |
| Colville | 0.3 /100 | #272 | Tragic $49,774 |
| Slovaks | 0.3 /100 | #273 | Tragic $49,753 |
| Immigrants | Senegal | 0.3 /100 | #274 | Tragic $49,742 |
| Immigrants | Kenya | 0.2 /100 | #275 | Tragic $49,633 |
| Dominicans | 0.2 /100 | #276 | Tragic $49,633 |
| Immigrants | Western Africa | 0.2 /100 | #277 | Tragic $49,621 |
| Nigerians | 0.1 /100 | #278 | Tragic $49,416 |
| Apache | 0.1 /100 | #279 | Tragic $49,395 |
| Hmong | 0.1 /100 | #280 | Tragic $49,364 |
| Immigrants | Nonimmigrants | 0.1 /100 | #281 | Tragic $49,348 |
| Alsatians | 0.1 /100 | #282 | Tragic $49,267 |
| Immigrants | Nigeria | 0.1 /100 | #283 | Tragic $49,174 |