Trinidadian and Tobagonian vs Immigrants from Russia Householder Income Under 25 years
COMPARE
Trinidadian and Tobagonian
Immigrants from Russia
Householder Income Under 25 years
Householder Income Under 25 years Comparison
Trinidadians and Tobagonians
Immigrants from Russia
$52,631
HOUSEHOLDER INCOME UNDER 25 YEARS
74.6/ 100
METRIC RATING
152nd/ 347
METRIC RANK
$55,891
HOUSEHOLDER INCOME UNDER 25 YEARS
100.0/ 100
METRIC RATING
37th/ 347
METRIC RANK
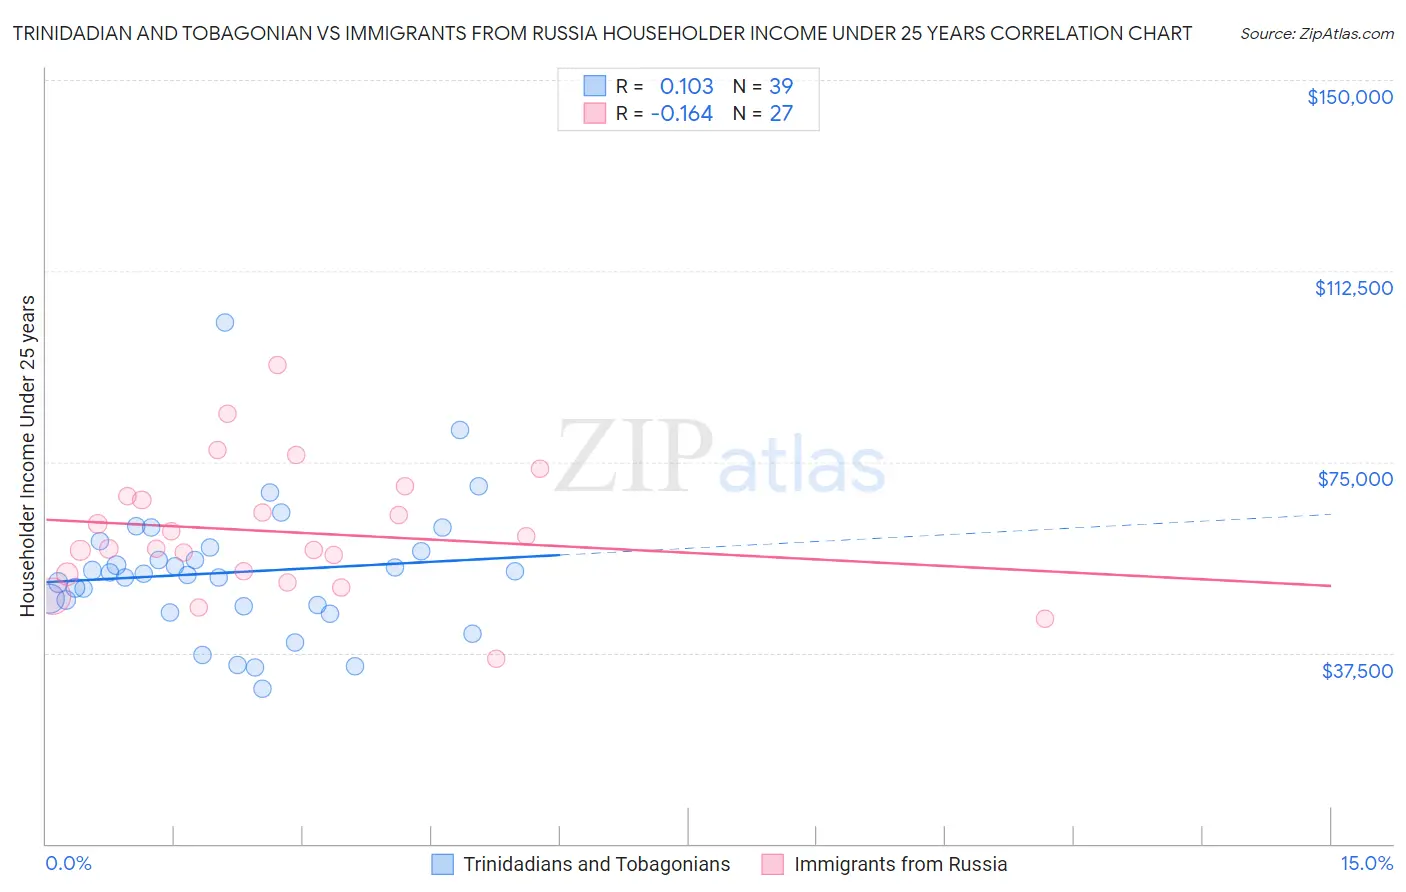
Trinidadian and Tobagonian vs Immigrants from Russia Householder Income Under 25 years Correlation Chart
The statistical analysis conducted on geographies consisting of 193,000,930 people shows a poor positive correlation between the proportion of Trinidadians and Tobagonians and household income with householder under the age of 25 in the United States with a correlation coefficient (R) of 0.103 and weighted average of $52,631. Similarly, the statistical analysis conducted on geographies consisting of 295,410,688 people shows a poor negative correlation between the proportion of Immigrants from Russia and household income with householder under the age of 25 in the United States with a correlation coefficient (R) of -0.164 and weighted average of $55,891, a difference of 6.2%.
Householder Income Under 25 years Correlation Summary
| Measurement | Trinidadian and Tobagonian | Immigrants from Russia |
| Minimum | $30,455 | $36,250 |
| Maximum | $102,312 | $93,974 |
| Range | $71,857 | $57,724 |
| Mean | $53,317 | $61,278 |
| Median | $52,934 | $57,969 |
| Interquartile 25% (IQ1) | $46,536 | $52,911 |
| Interquartile 75% (IQ3) | $58,164 | $68,185 |
| Interquartile Range (IQR) | $11,628 | $15,274 |
| Standard Deviation (Sample) | $13,212 | $12,683 |
| Standard Deviation (Population) | $13,042 | $12,446 |
Similar Demographics by Householder Income Under 25 years
Demographics Similar to Trinidadians and Tobagonians by Householder Income Under 25 years
In terms of householder income under 25 years, the demographic groups most similar to Trinidadians and Tobagonians are Immigrants from Scotland ($52,638, a difference of 0.010%), Central American ($52,626, a difference of 0.010%), Immigrants from Costa Rica ($52,643, a difference of 0.020%), Immigrants from the Azores ($52,621, a difference of 0.020%), and Scandinavian ($52,654, a difference of 0.040%).
| Demographics | Rating | Rank | Householder Income Under 25 years |
| Immigrants | Western Europe | 86.7 /100 | #145 | Excellent $52,957 |
| Immigrants | Hungary | 81.6 /100 | #146 | Excellent $52,798 |
| Latvians | 81.0 /100 | #147 | Excellent $52,783 |
| French Canadians | 76.5 /100 | #148 | Good $52,672 |
| Scandinavians | 75.7 /100 | #149 | Good $52,654 |
| Immigrants | Costa Rica | 75.2 /100 | #150 | Good $52,643 |
| Immigrants | Scotland | 75.0 /100 | #151 | Good $52,638 |
| Trinidadians and Tobagonians | 74.6 /100 | #152 | Good $52,631 |
| Central Americans | 74.4 /100 | #153 | Good $52,626 |
| Immigrants | Azores | 74.2 /100 | #154 | Good $52,621 |
| Immigrants | Denmark | 73.8 /100 | #155 | Good $52,612 |
| Immigrants | Nepal | 73.7 /100 | #156 | Good $52,611 |
| Ghanaians | 72.9 /100 | #157 | Good $52,594 |
| Immigrants | Netherlands | 72.8 /100 | #158 | Good $52,592 |
| Mongolians | 70.2 /100 | #159 | Good $52,540 |
Demographics Similar to Immigrants from Russia by Householder Income Under 25 years
In terms of householder income under 25 years, the demographic groups most similar to Immigrants from Russia are Immigrants from Iran ($55,880, a difference of 0.020%), Tlingit-Haida ($55,914, a difference of 0.040%), Immigrants from Israel ($55,913, a difference of 0.040%), Immigrants from Japan ($55,932, a difference of 0.070%), and Inupiat ($55,935, a difference of 0.080%).
| Demographics | Rating | Rank | Householder Income Under 25 years |
| Immigrants | Moldova | 100.0 /100 | #30 | Exceptional $56,168 |
| Vietnamese | 100.0 /100 | #31 | Exceptional $56,127 |
| Peruvians | 100.0 /100 | #32 | Exceptional $56,052 |
| Inupiat | 100.0 /100 | #33 | Exceptional $55,935 |
| Immigrants | Japan | 100.0 /100 | #34 | Exceptional $55,932 |
| Tlingit-Haida | 100.0 /100 | #35 | Exceptional $55,914 |
| Immigrants | Israel | 100.0 /100 | #36 | Exceptional $55,913 |
| Immigrants | Russia | 100.0 /100 | #37 | Exceptional $55,891 |
| Immigrants | Iran | 100.0 /100 | #38 | Exceptional $55,880 |
| Immigrants | Belarus | 100.0 /100 | #39 | Exceptional $55,743 |
| Immigrants | Greece | 100.0 /100 | #40 | Exceptional $55,727 |
| Immigrants | Guyana | 100.0 /100 | #41 | Exceptional $55,726 |
| Immigrants | Korea | 100.0 /100 | #42 | Exceptional $55,716 |
| Immigrants | South Eastern Asia | 100.0 /100 | #43 | Exceptional $55,714 |
| Paraguayans | 100.0 /100 | #44 | Exceptional $55,614 |