Sri Lankan vs Immigrants from Russia Unemployment Among Seniors over 65 years
COMPARE
Sri Lankan
Immigrants from Russia
Unemployment Among Seniors over 65 years
Unemployment Among Seniors over 65 years Comparison
Sri Lankans
Immigrants from Russia
5.1%
UNEMPLOYMENT AMONG SENIORS OVER 65 YEARS
87.4/ 100
METRIC RATING
127th/ 347
METRIC RANK
5.1%
UNEMPLOYMENT AMONG SENIORS OVER 65 YEARS
78.5/ 100
METRIC RATING
146th/ 347
METRIC RANK
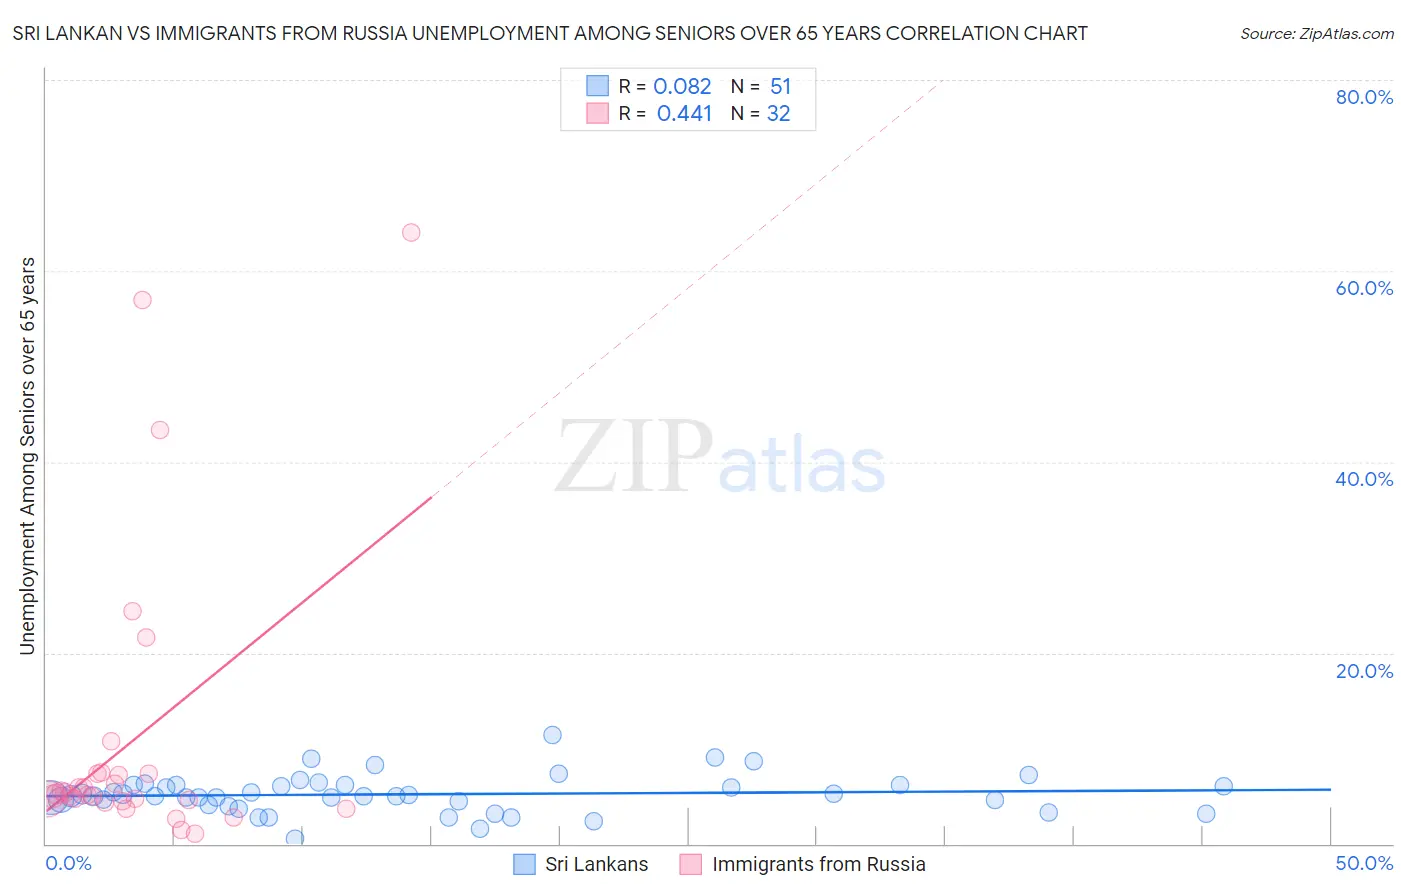
Sri Lankan vs Immigrants from Russia Unemployment Among Seniors over 65 years Correlation Chart
The statistical analysis conducted on geographies consisting of 391,605,797 people shows a slight positive correlation between the proportion of Sri Lankans and unemployment rate amomg seniors over the age of 65 in the United States with a correlation coefficient (R) of 0.082 and weighted average of 5.1%. Similarly, the statistical analysis conducted on geographies consisting of 319,054,235 people shows a moderate positive correlation between the proportion of Immigrants from Russia and unemployment rate amomg seniors over the age of 65 in the United States with a correlation coefficient (R) of 0.441 and weighted average of 5.1%, a difference of 0.52%.
Unemployment Among Seniors over 65 years Correlation Summary
| Measurement | Sri Lankan | Immigrants from Russia |
| Minimum | 0.50% | 1.0% |
| Maximum | 11.4% | 64.0% |
| Range | 10.9% | 63.0% |
| Mean | 5.2% | 10.8% |
| Median | 5.0% | 5.2% |
| Interquartile 25% (IQ1) | 4.1% | 4.5% |
| Interquartile 75% (IQ3) | 6.2% | 7.3% |
| Interquartile Range (IQR) | 2.1% | 2.8% |
| Standard Deviation (Sample) | 2.0% | 15.4% |
| Standard Deviation (Population) | 2.0% | 15.1% |
Demographics Similar to Sri Lankans and Immigrants from Russia by Unemployment Among Seniors over 65 years
In terms of unemployment among seniors over 65 years, the demographic groups most similar to Sri Lankans are Immigrants from Sri Lanka (5.1%, a difference of 0.0%), Australian (5.1%, a difference of 0.020%), Immigrants from England (5.1%, a difference of 0.050%), Iranian (5.1%, a difference of 0.050%), and Immigrants from Australia (5.1%, a difference of 0.11%). Similarly, the demographic groups most similar to Immigrants from Russia are Spanish (5.1%, a difference of 0.010%), Senegalese (5.1%, a difference of 0.090%), Polish (5.1%, a difference of 0.090%), Immigrants from Indonesia (5.1%, a difference of 0.12%), and Cherokee (5.1%, a difference of 0.15%).
| Demographics | Rating | Rank | Unemployment Among Seniors over 65 years |
| Immigrants | Sri Lanka | 87.4 /100 | #126 | Excellent 5.1% |
| Sri Lankans | 87.4 /100 | #127 | Excellent 5.1% |
| Australians | 87.1 /100 | #128 | Excellent 5.1% |
| Immigrants | England | 86.7 /100 | #129 | Excellent 5.1% |
| Iranians | 86.6 /100 | #130 | Excellent 5.1% |
| Immigrants | Australia | 85.8 /100 | #131 | Excellent 5.1% |
| Chileans | 85.6 /100 | #132 | Excellent 5.1% |
| Syrians | 85.3 /100 | #133 | Excellent 5.1% |
| Turks | 84.9 /100 | #134 | Excellent 5.1% |
| Ukrainians | 84.4 /100 | #135 | Excellent 5.1% |
| Whites/Caucasians | 84.4 /100 | #136 | Excellent 5.1% |
| Arabs | 84.3 /100 | #137 | Excellent 5.1% |
| New Zealanders | 83.2 /100 | #138 | Excellent 5.1% |
| Immigrants | Panama | 83.0 /100 | #139 | Excellent 5.1% |
| Immigrants | Chile | 83.0 /100 | #140 | Excellent 5.1% |
| Cherokee | 81.6 /100 | #141 | Excellent 5.1% |
| Immigrants | Indonesia | 81.0 /100 | #142 | Excellent 5.1% |
| Senegalese | 80.4 /100 | #143 | Excellent 5.1% |
| Poles | 80.3 /100 | #144 | Excellent 5.1% |
| Spanish | 78.8 /100 | #145 | Good 5.1% |
| Immigrants | Russia | 78.5 /100 | #146 | Good 5.1% |