Hmong vs Immigrants from Russia Householder Income Under 25 years
COMPARE
Hmong
Immigrants from Russia
Householder Income Under 25 years
Householder Income Under 25 years Comparison
Hmong
Immigrants from Russia
$49,364
HOUSEHOLDER INCOME UNDER 25 YEARS
0.1/ 100
METRIC RATING
280th/ 347
METRIC RANK
$55,891
HOUSEHOLDER INCOME UNDER 25 YEARS
100.0/ 100
METRIC RATING
37th/ 347
METRIC RANK
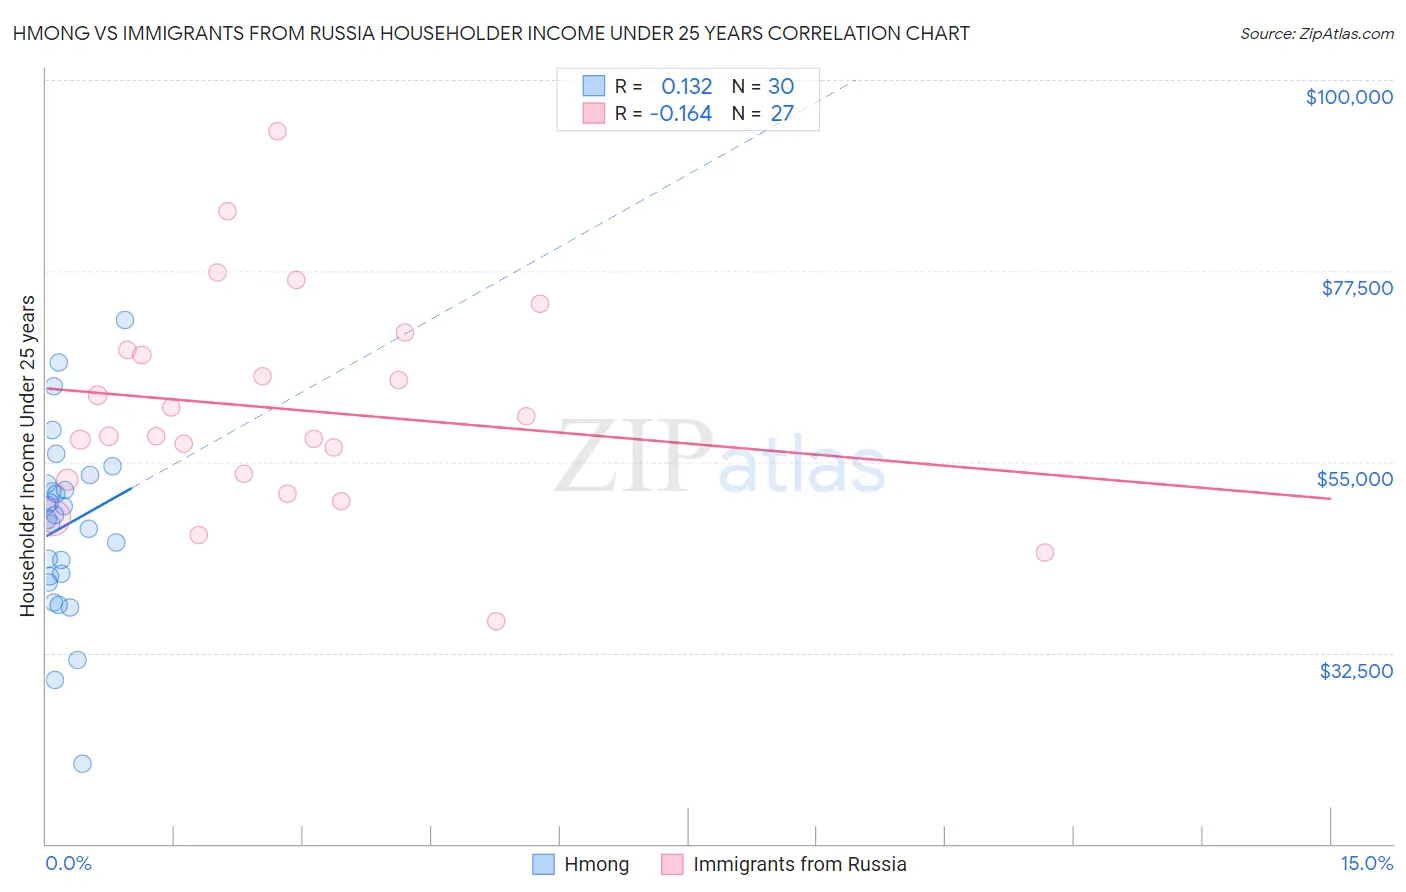
Hmong vs Immigrants from Russia Householder Income Under 25 years Correlation Chart
The statistical analysis conducted on geographies consisting of 24,241,082 people shows a poor positive correlation between the proportion of Hmong and household income with householder under the age of 25 in the United States with a correlation coefficient (R) of 0.132 and weighted average of $49,364. Similarly, the statistical analysis conducted on geographies consisting of 295,410,688 people shows a poor negative correlation between the proportion of Immigrants from Russia and household income with householder under the age of 25 in the United States with a correlation coefficient (R) of -0.164 and weighted average of $55,891, a difference of 13.2%.
Householder Income Under 25 years Correlation Summary
| Measurement | Hmong | Immigrants from Russia |
| Minimum | $19,375 | $36,250 |
| Maximum | $71,711 | $93,974 |
| Range | $52,336 | $57,724 |
| Mean | $47,504 | $61,278 |
| Median | $48,507 | $57,969 |
| Interquartile 25% (IQ1) | $41,574 | $52,911 |
| Interquartile 75% (IQ3) | $52,449 | $68,185 |
| Interquartile Range (IQR) | $10,875 | $15,274 |
| Standard Deviation (Sample) | $10,797 | $12,683 |
| Standard Deviation (Population) | $10,616 | $12,446 |
Similar Demographics by Householder Income Under 25 years
Demographics Similar to Hmong by Householder Income Under 25 years
In terms of householder income under 25 years, the demographic groups most similar to Hmong are Nonimmigrants ($49,348, a difference of 0.030%), Apache ($49,395, a difference of 0.060%), Nigerian ($49,416, a difference of 0.11%), Alsatian ($49,267, a difference of 0.20%), and Immigrants from Nigeria ($49,174, a difference of 0.39%).
| Demographics | Rating | Rank | Householder Income Under 25 years |
| Slovaks | 0.3 /100 | #273 | Tragic $49,753 |
| Immigrants | Senegal | 0.3 /100 | #274 | Tragic $49,742 |
| Immigrants | Kenya | 0.2 /100 | #275 | Tragic $49,633 |
| Dominicans | 0.2 /100 | #276 | Tragic $49,633 |
| Immigrants | Western Africa | 0.2 /100 | #277 | Tragic $49,621 |
| Nigerians | 0.1 /100 | #278 | Tragic $49,416 |
| Apache | 0.1 /100 | #279 | Tragic $49,395 |
| Hmong | 0.1 /100 | #280 | Tragic $49,364 |
| Immigrants | Nonimmigrants | 0.1 /100 | #281 | Tragic $49,348 |
| Alsatians | 0.1 /100 | #282 | Tragic $49,267 |
| Immigrants | Nigeria | 0.1 /100 | #283 | Tragic $49,174 |
| Carpatho Rusyns | 0.1 /100 | #284 | Tragic $49,113 |
| Scotch-Irish | 0.0 /100 | #285 | Tragic $49,039 |
| French American Indians | 0.0 /100 | #286 | Tragic $48,977 |
| Senegalese | 0.0 /100 | #287 | Tragic $48,953 |
Demographics Similar to Immigrants from Russia by Householder Income Under 25 years
In terms of householder income under 25 years, the demographic groups most similar to Immigrants from Russia are Immigrants from Iran ($55,880, a difference of 0.020%), Tlingit-Haida ($55,914, a difference of 0.040%), Immigrants from Israel ($55,913, a difference of 0.040%), Immigrants from Japan ($55,932, a difference of 0.070%), and Inupiat ($55,935, a difference of 0.080%).
| Demographics | Rating | Rank | Householder Income Under 25 years |
| Immigrants | Moldova | 100.0 /100 | #30 | Exceptional $56,168 |
| Vietnamese | 100.0 /100 | #31 | Exceptional $56,127 |
| Peruvians | 100.0 /100 | #32 | Exceptional $56,052 |
| Inupiat | 100.0 /100 | #33 | Exceptional $55,935 |
| Immigrants | Japan | 100.0 /100 | #34 | Exceptional $55,932 |
| Tlingit-Haida | 100.0 /100 | #35 | Exceptional $55,914 |
| Immigrants | Israel | 100.0 /100 | #36 | Exceptional $55,913 |
| Immigrants | Russia | 100.0 /100 | #37 | Exceptional $55,891 |
| Immigrants | Iran | 100.0 /100 | #38 | Exceptional $55,880 |
| Immigrants | Belarus | 100.0 /100 | #39 | Exceptional $55,743 |
| Immigrants | Greece | 100.0 /100 | #40 | Exceptional $55,727 |
| Immigrants | Guyana | 100.0 /100 | #41 | Exceptional $55,726 |
| Immigrants | Korea | 100.0 /100 | #42 | Exceptional $55,716 |
| Immigrants | South Eastern Asia | 100.0 /100 | #43 | Exceptional $55,714 |
| Paraguayans | 100.0 /100 | #44 | Exceptional $55,614 |