Sri Lankan vs Immigrants from Iran Per Capita Income
COMPARE
Sri Lankan
Immigrants from Iran
Per Capita Income
Per Capita Income Comparison
Sri Lankans
Immigrants from Iran
$44,014
PER CAPITA INCOME
59.8/ 100
METRIC RATING
164th/ 347
METRIC RANK
$57,759
PER CAPITA INCOME
100.0/ 100
METRIC RATING
5th/ 347
METRIC RANK
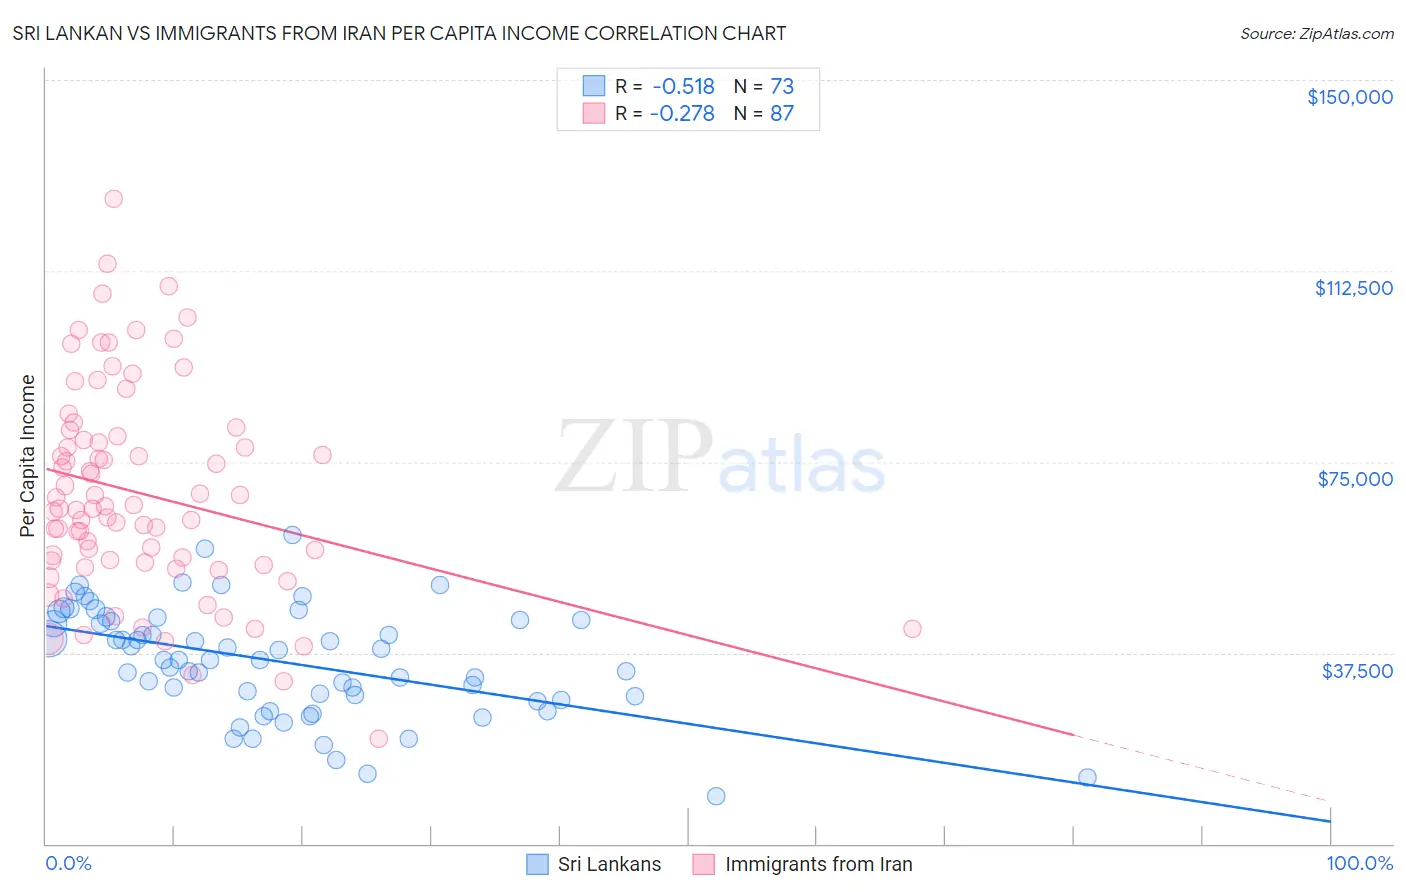
Sri Lankan vs Immigrants from Iran Per Capita Income Correlation Chart
The statistical analysis conducted on geographies consisting of 440,642,250 people shows a substantial negative correlation between the proportion of Sri Lankans and per capita income in the United States with a correlation coefficient (R) of -0.518 and weighted average of $44,014. Similarly, the statistical analysis conducted on geographies consisting of 279,905,207 people shows a weak negative correlation between the proportion of Immigrants from Iran and per capita income in the United States with a correlation coefficient (R) of -0.278 and weighted average of $57,759, a difference of 31.2%.
Per Capita Income Correlation Summary
| Measurement | Sri Lankan | Immigrants from Iran |
| Minimum | $9,224 | $20,655 |
| Maximum | $60,722 | $126,563 |
| Range | $51,498 | $105,908 |
| Mean | $35,781 | $68,785 |
| Median | $36,115 | $65,816 |
| Interquartile 25% (IQ1) | $28,668 | $55,345 |
| Interquartile 75% (IQ3) | $43,934 | $79,969 |
| Interquartile Range (IQR) | $15,265 | $24,624 |
| Standard Deviation (Sample) | $10,742 | $20,524 |
| Standard Deviation (Population) | $10,669 | $20,406 |
Similar Demographics by Per Capita Income
Demographics Similar to Sri Lankans by Per Capita Income
In terms of per capita income, the demographic groups most similar to Sri Lankans are Immigrants from Philippines ($44,000, a difference of 0.030%), Immigrants from Uruguay ($43,997, a difference of 0.040%), English ($43,982, a difference of 0.070%), Immigrants from South America ($44,068, a difference of 0.12%), and Swiss ($44,076, a difference of 0.14%).
| Demographics | Rating | Rank | Per Capita Income |
| South American Indians | 64.8 /100 | #157 | Good $44,206 |
| Immigrants | Nepal | 64.3 /100 | #158 | Good $44,187 |
| South Americans | 62.4 /100 | #159 | Good $44,114 |
| Danes | 61.9 /100 | #160 | Good $44,095 |
| Costa Ricans | 61.8 /100 | #161 | Good $44,090 |
| Swiss | 61.4 /100 | #162 | Good $44,076 |
| Immigrants | South America | 61.2 /100 | #163 | Good $44,068 |
| Sri Lankans | 59.8 /100 | #164 | Average $44,014 |
| Immigrants | Philippines | 59.4 /100 | #165 | Average $44,000 |
| Immigrants | Uruguay | 59.3 /100 | #166 | Average $43,997 |
| English | 58.9 /100 | #167 | Average $43,982 |
| Belgians | 58.1 /100 | #168 | Average $43,951 |
| Immigrants | Peru | 55.3 /100 | #169 | Average $43,852 |
| Scandinavians | 55.2 /100 | #170 | Average $43,848 |
| Immigrants | Eastern Africa | 54.9 /100 | #171 | Average $43,838 |
Demographics Similar to Immigrants from Iran by Per Capita Income
In terms of per capita income, the demographic groups most similar to Immigrants from Iran are Immigrants from Taiwan ($57,742, a difference of 0.030%), Immigrants from Australia ($57,953, a difference of 0.34%), Immigrants from Israel ($57,384, a difference of 0.65%), Immigrants from Singapore ($58,353, a difference of 1.0%), and Iranian ($58,786, a difference of 1.8%).
| Demographics | Rating | Rank | Per Capita Income |
| Filipinos | 100.0 /100 | #1 | Exceptional $59,066 |
| Iranians | 100.0 /100 | #2 | Exceptional $58,786 |
| Immigrants | Singapore | 100.0 /100 | #3 | Exceptional $58,353 |
| Immigrants | Australia | 100.0 /100 | #4 | Exceptional $57,953 |
| Immigrants | Iran | 100.0 /100 | #5 | Exceptional $57,759 |
| Immigrants | Taiwan | 100.0 /100 | #6 | Exceptional $57,742 |
| Immigrants | Israel | 100.0 /100 | #7 | Exceptional $57,384 |
| Immigrants | Hong Kong | 100.0 /100 | #8 | Exceptional $56,709 |
| Immigrants | Ireland | 100.0 /100 | #9 | Exceptional $56,584 |
| Okinawans | 100.0 /100 | #10 | Exceptional $55,817 |
| Eastern Europeans | 100.0 /100 | #11 | Exceptional $55,780 |
| Immigrants | Sweden | 100.0 /100 | #12 | Exceptional $55,582 |
| Immigrants | India | 100.0 /100 | #13 | Exceptional $55,268 |
| Immigrants | Belgium | 100.0 /100 | #14 | Exceptional $55,082 |
| Cypriots | 100.0 /100 | #15 | Exceptional $54,899 |