Tlingit-Haida vs American Householder Income Ages 25 - 44 years
COMPARE
Tlingit-Haida
American
Householder Income Ages 25 - 44 years
Householder Income Ages 25 - 44 years Comparison
Tlingit-Haida
Americans
$92,987
HOUSEHOLDER INCOME AGES 25 - 44 YEARS
29.4/ 100
METRIC RATING
191st/ 347
METRIC RANK
$84,791
HOUSEHOLDER INCOME AGES 25 - 44 YEARS
0.4/ 100
METRIC RATING
260th/ 347
METRIC RANK
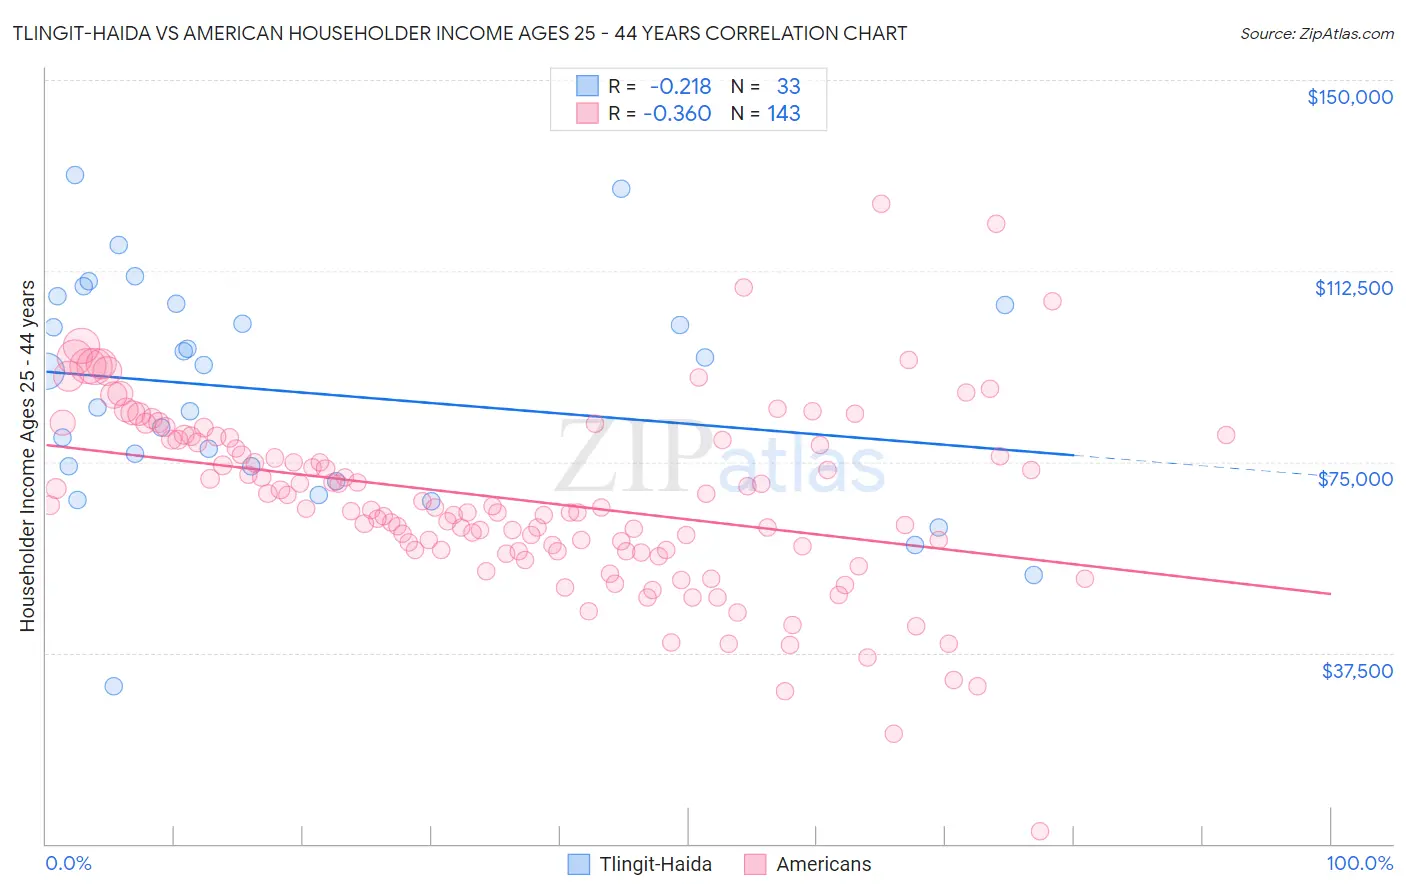
Tlingit-Haida vs American Householder Income Ages 25 - 44 years Correlation Chart
The statistical analysis conducted on geographies consisting of 60,815,061 people shows a weak negative correlation between the proportion of Tlingit-Haida and household income with householder between the ages 25 and 44 in the United States with a correlation coefficient (R) of -0.218 and weighted average of $92,987. Similarly, the statistical analysis conducted on geographies consisting of 574,694,718 people shows a mild negative correlation between the proportion of Americans and household income with householder between the ages 25 and 44 in the United States with a correlation coefficient (R) of -0.360 and weighted average of $84,791, a difference of 9.7%.
Householder Income Ages 25 - 44 years Correlation Summary
| Measurement | Tlingit-Haida | American |
| Minimum | $30,938 | $2,499 |
| Maximum | $131,395 | $125,750 |
| Range | $100,457 | $123,251 |
| Mean | $88,610 | $67,597 |
| Median | $92,732 | $65,930 |
| Interquartile 25% (IQ1) | $72,697 | $57,596 |
| Interquartile 75% (IQ3) | $105,957 | $79,418 |
| Interquartile Range (IQR) | $33,260 | $21,822 |
| Standard Deviation (Sample) | $22,410 | $18,011 |
| Standard Deviation (Population) | $22,068 | $17,948 |
Similar Demographics by Householder Income Ages 25 - 44 years
Demographics Similar to Tlingit-Haida by Householder Income Ages 25 - 44 years
In terms of householder income ages 25 - 44 years, the demographic groups most similar to Tlingit-Haida are Welsh ($93,039, a difference of 0.060%), Dutch ($93,081, a difference of 0.10%), Immigrants from Costa Rica ($92,876, a difference of 0.12%), Immigrants from Sierra Leone ($93,115, a difference of 0.14%), and Spaniard ($93,366, a difference of 0.41%).
| Demographics | Rating | Rank | Householder Income Ages 25 - 44 years |
| Germans | 36.0 /100 | #184 | Fair $93,531 |
| Immigrants | Eritrea | 35.2 /100 | #185 | Fair $93,466 |
| Sierra Leoneans | 34.8 /100 | #186 | Fair $93,435 |
| Spaniards | 34.0 /100 | #187 | Fair $93,366 |
| Immigrants | Sierra Leone | 30.9 /100 | #188 | Fair $93,115 |
| Dutch | 30.5 /100 | #189 | Fair $93,081 |
| Welsh | 30.0 /100 | #190 | Fair $93,039 |
| Tlingit-Haida | 29.4 /100 | #191 | Fair $92,987 |
| Immigrants | Costa Rica | 28.2 /100 | #192 | Fair $92,876 |
| Samoans | 23.0 /100 | #193 | Fair $92,385 |
| Immigrants | Azores | 22.4 /100 | #194 | Fair $92,322 |
| Celtics | 21.6 /100 | #195 | Fair $92,241 |
| Immigrants | Colombia | 21.3 /100 | #196 | Fair $92,204 |
| Spanish | 21.2 /100 | #197 | Fair $92,200 |
| Vietnamese | 20.2 /100 | #198 | Fair $92,089 |
Demographics Similar to Americans by Householder Income Ages 25 - 44 years
In terms of householder income ages 25 - 44 years, the demographic groups most similar to Americans are Immigrants from Senegal ($84,848, a difference of 0.070%), Immigrants from Nicaragua ($84,914, a difference of 0.14%), Inupiat ($84,619, a difference of 0.20%), Cree ($84,574, a difference of 0.26%), and Belizean ($84,534, a difference of 0.30%).
| Demographics | Rating | Rank | Householder Income Ages 25 - 44 years |
| British West Indians | 0.7 /100 | #253 | Tragic $85,565 |
| Immigrants | Laos | 0.7 /100 | #254 | Tragic $85,553 |
| German Russians | 0.6 /100 | #255 | Tragic $85,220 |
| Central Americans | 0.5 /100 | #256 | Tragic $85,144 |
| Mexican American Indians | 0.5 /100 | #257 | Tragic $85,066 |
| Immigrants | Nicaragua | 0.5 /100 | #258 | Tragic $84,914 |
| Immigrants | Senegal | 0.5 /100 | #259 | Tragic $84,848 |
| Americans | 0.4 /100 | #260 | Tragic $84,791 |
| Inupiat | 0.4 /100 | #261 | Tragic $84,619 |
| Cree | 0.4 /100 | #262 | Tragic $84,574 |
| Belizeans | 0.4 /100 | #263 | Tragic $84,534 |
| Osage | 0.4 /100 | #264 | Tragic $84,461 |
| Sudanese | 0.4 /100 | #265 | Tragic $84,401 |
| Immigrants | Cabo Verde | 0.3 /100 | #266 | Tragic $84,304 |
| Hmong | 0.3 /100 | #267 | Tragic $84,258 |