Immigrants from Laos vs American Householder Income Ages 25 - 44 years
COMPARE
Immigrants from Laos
American
Householder Income Ages 25 - 44 years
Householder Income Ages 25 - 44 years Comparison
Immigrants from Laos
Americans
$85,553
HOUSEHOLDER INCOME AGES 25 - 44 YEARS
0.7/ 100
METRIC RATING
254th/ 347
METRIC RANK
$84,791
HOUSEHOLDER INCOME AGES 25 - 44 YEARS
0.4/ 100
METRIC RATING
260th/ 347
METRIC RANK
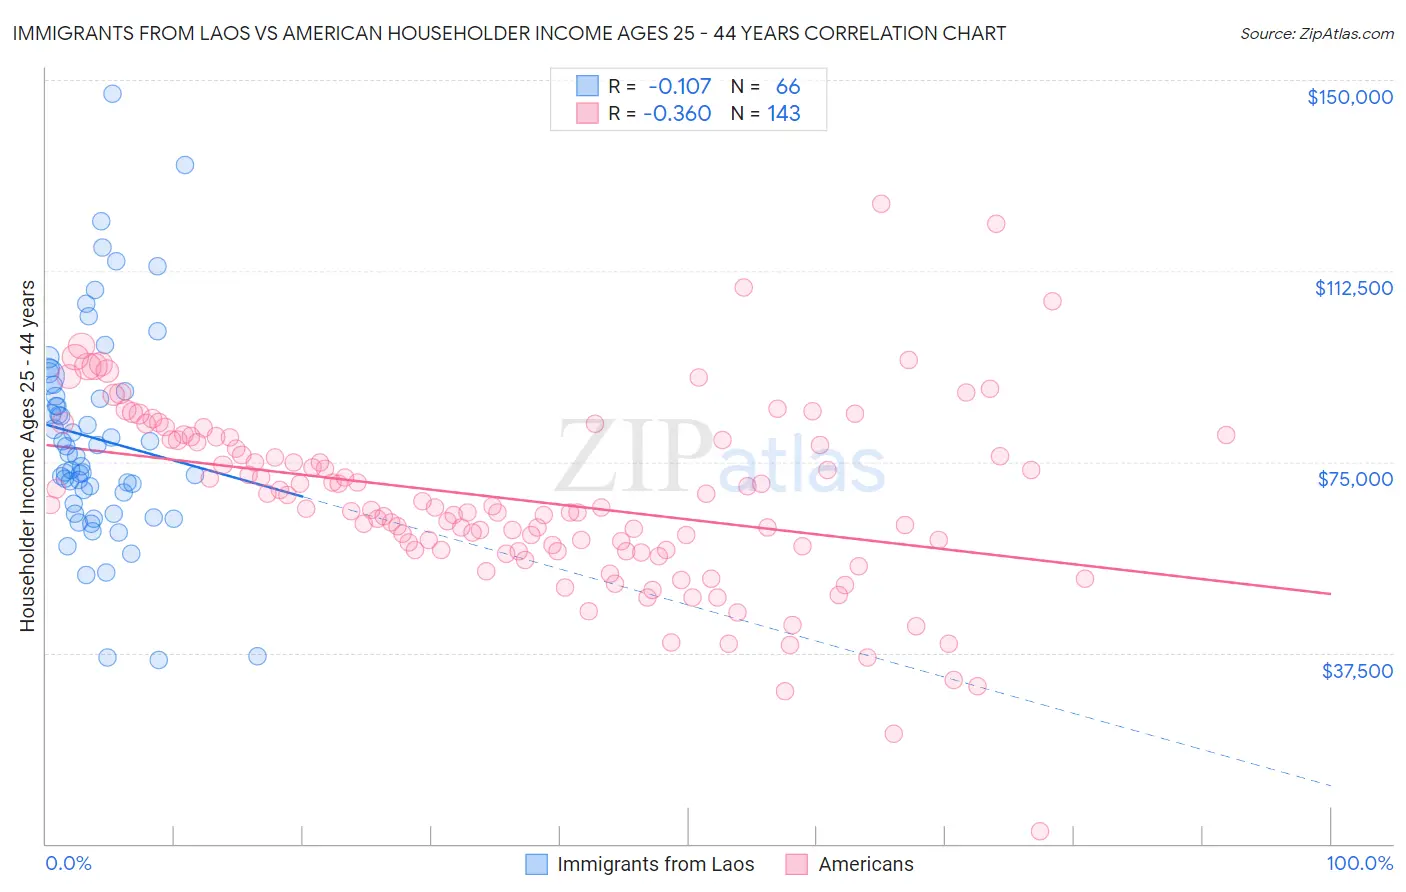
Immigrants from Laos vs American Householder Income Ages 25 - 44 years Correlation Chart
The statistical analysis conducted on geographies consisting of 201,332,387 people shows a poor negative correlation between the proportion of Immigrants from Laos and household income with householder between the ages 25 and 44 in the United States with a correlation coefficient (R) of -0.107 and weighted average of $85,553. Similarly, the statistical analysis conducted on geographies consisting of 574,694,718 people shows a mild negative correlation between the proportion of Americans and household income with householder between the ages 25 and 44 in the United States with a correlation coefficient (R) of -0.360 and weighted average of $84,791, a difference of 0.90%.
Householder Income Ages 25 - 44 years Correlation Summary
| Measurement | Immigrants from Laos | American |
| Minimum | $36,106 | $2,499 |
| Maximum | $147,348 | $125,750 |
| Range | $111,242 | $123,251 |
| Mean | $79,556 | $67,597 |
| Median | $76,403 | $65,930 |
| Interquartile 25% (IQ1) | $66,885 | $57,596 |
| Interquartile 75% (IQ3) | $88,750 | $79,418 |
| Interquartile Range (IQR) | $21,865 | $21,822 |
| Standard Deviation (Sample) | $21,017 | $18,011 |
| Standard Deviation (Population) | $20,857 | $17,948 |
Demographics Similar to Immigrants from Laos and Americans by Householder Income Ages 25 - 44 years
In terms of householder income ages 25 - 44 years, the demographic groups most similar to Immigrants from Laos are British West Indian ($85,565, a difference of 0.010%), Immigrants from Western Africa ($85,676, a difference of 0.14%), Cape Verdean ($85,758, a difference of 0.24%), Pennsylvania German ($85,836, a difference of 0.33%), and German Russian ($85,220, a difference of 0.39%). Similarly, the demographic groups most similar to Americans are Immigrants from Senegal ($84,848, a difference of 0.070%), Immigrants from Nicaragua ($84,914, a difference of 0.14%), Inupiat ($84,619, a difference of 0.20%), Cree ($84,574, a difference of 0.26%), and Belizean ($84,534, a difference of 0.30%).
| Demographics | Rating | Rank | Householder Income Ages 25 - 44 years |
| Immigrants | Nigeria | 1.2 /100 | #247 | Tragic $86,589 |
| Immigrants | Sudan | 0.9 /100 | #248 | Tragic $86,109 |
| French American Indians | 0.8 /100 | #249 | Tragic $85,899 |
| Pennsylvania Germans | 0.8 /100 | #250 | Tragic $85,836 |
| Cape Verdeans | 0.8 /100 | #251 | Tragic $85,758 |
| Immigrants | Western Africa | 0.7 /100 | #252 | Tragic $85,676 |
| British West Indians | 0.7 /100 | #253 | Tragic $85,565 |
| Immigrants | Laos | 0.7 /100 | #254 | Tragic $85,553 |
| German Russians | 0.6 /100 | #255 | Tragic $85,220 |
| Central Americans | 0.5 /100 | #256 | Tragic $85,144 |
| Mexican American Indians | 0.5 /100 | #257 | Tragic $85,066 |
| Immigrants | Nicaragua | 0.5 /100 | #258 | Tragic $84,914 |
| Immigrants | Senegal | 0.5 /100 | #259 | Tragic $84,848 |
| Americans | 0.4 /100 | #260 | Tragic $84,791 |
| Inupiat | 0.4 /100 | #261 | Tragic $84,619 |
| Cree | 0.4 /100 | #262 | Tragic $84,574 |
| Belizeans | 0.4 /100 | #263 | Tragic $84,534 |
| Osage | 0.4 /100 | #264 | Tragic $84,461 |
| Sudanese | 0.4 /100 | #265 | Tragic $84,401 |
| Immigrants | Cabo Verde | 0.3 /100 | #266 | Tragic $84,304 |
| Hmong | 0.3 /100 | #267 | Tragic $84,258 |