Spanish vs Luxembourger Median Household Income
COMPARE
Spanish
Luxembourger
Median Household Income
Median Household Income Comparison
Spanish
Luxembourgers
$83,343
MEDIAN HOUSEHOLD INCOME
24.4/ 100
METRIC RATING
201st/ 347
METRIC RANK
$86,418
MEDIAN HOUSEHOLD INCOME
70.0/ 100
METRIC RATING
160th/ 347
METRIC RANK
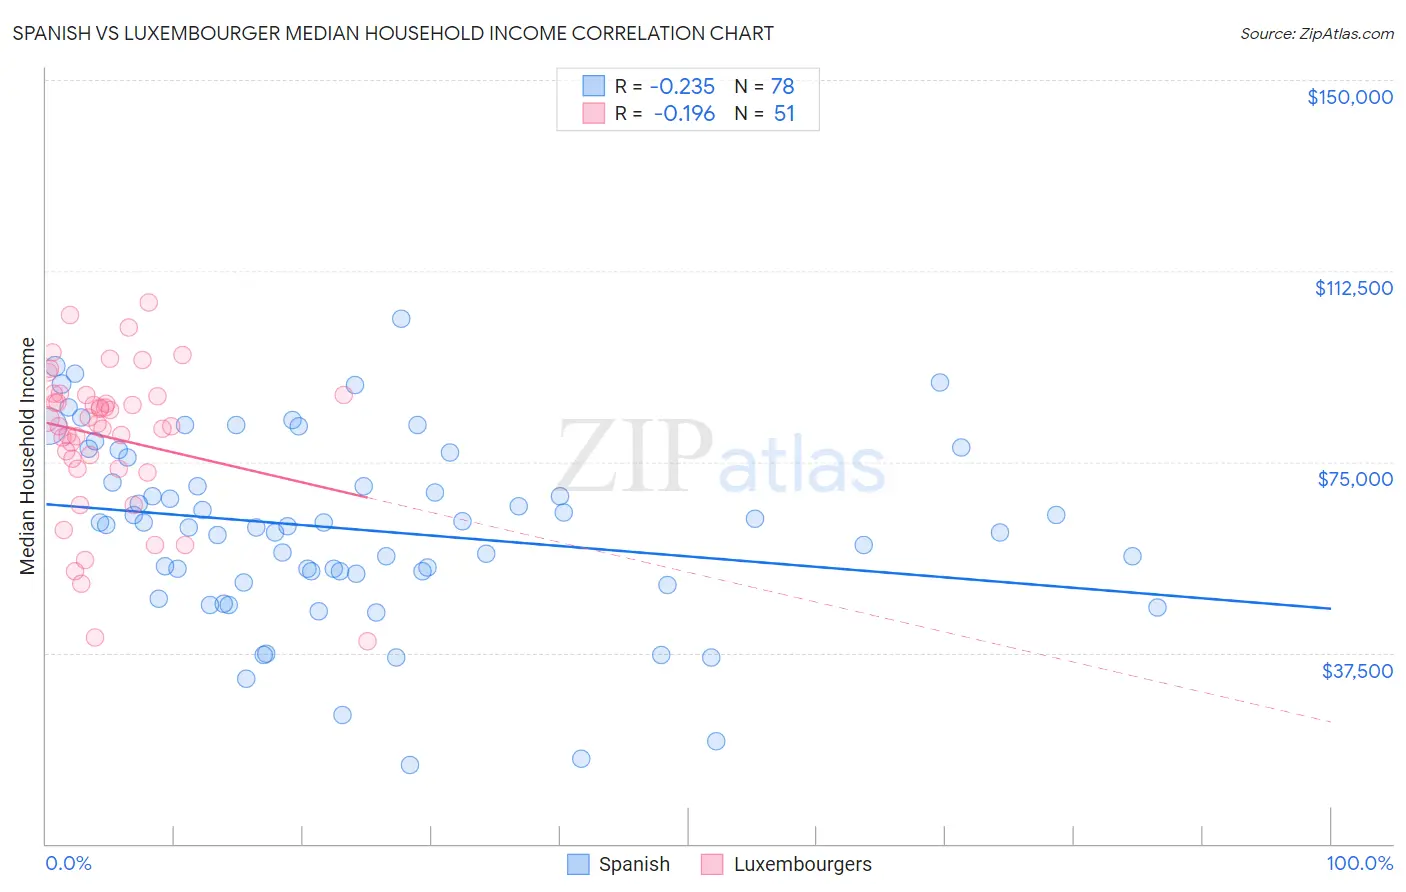
Spanish vs Luxembourger Median Household Income Correlation Chart
The statistical analysis conducted on geographies consisting of 421,807,066 people shows a weak negative correlation between the proportion of Spanish and median household income in the United States with a correlation coefficient (R) of -0.235 and weighted average of $83,343. Similarly, the statistical analysis conducted on geographies consisting of 144,630,176 people shows a poor negative correlation between the proportion of Luxembourgers and median household income in the United States with a correlation coefficient (R) of -0.196 and weighted average of $86,418, a difference of 3.7%.
Median Household Income Correlation Summary
| Measurement | Spanish | Luxembourger |
| Minimum | $15,577 | $39,750 |
| Maximum | $103,194 | $106,423 |
| Range | $87,617 | $66,673 |
| Mean | $61,640 | $79,856 |
| Median | $62,411 | $82,566 |
| Interquartile 25% (IQ1) | $53,047 | $73,750 |
| Interquartile 75% (IQ3) | $75,942 | $88,077 |
| Interquartile Range (IQR) | $22,895 | $14,327 |
| Standard Deviation (Sample) | $18,137 | $14,707 |
| Standard Deviation (Population) | $18,021 | $14,562 |
Similar Demographics by Median Household Income
Demographics Similar to Spanish by Median Household Income
In terms of median household income, the demographic groups most similar to Spanish are Tsimshian ($83,346, a difference of 0.0%), German ($83,358, a difference of 0.020%), Immigrants from Thailand ($83,327, a difference of 0.020%), Immigrants from Cambodia ($83,304, a difference of 0.050%), and Japanese ($83,395, a difference of 0.060%).
| Demographics | Rating | Rank | Median Household Income |
| Ghanaians | 27.4 /100 | #194 | Fair $83,582 |
| Immigrants | Armenia | 27.0 /100 | #195 | Fair $83,555 |
| French | 26.0 /100 | #196 | Fair $83,468 |
| Aleuts | 25.7 /100 | #197 | Fair $83,446 |
| Japanese | 25.1 /100 | #198 | Fair $83,395 |
| Germans | 24.6 /100 | #199 | Fair $83,358 |
| Tsimshian | 24.5 /100 | #200 | Fair $83,346 |
| Spanish | 24.4 /100 | #201 | Fair $83,343 |
| Immigrants | Thailand | 24.3 /100 | #202 | Fair $83,327 |
| Immigrants | Cambodia | 24.0 /100 | #203 | Fair $83,304 |
| Immigrants | Africa | 23.8 /100 | #204 | Fair $83,289 |
| Celtics | 22.7 /100 | #205 | Fair $83,193 |
| Immigrants | Kenya | 21.3 /100 | #206 | Fair $83,068 |
| Dutch | 20.3 /100 | #207 | Fair $82,971 |
| French Canadians | 18.7 /100 | #208 | Poor $82,810 |
Demographics Similar to Luxembourgers by Median Household Income
In terms of median household income, the demographic groups most similar to Luxembourgers are Immigrants from Uzbekistan ($86,425, a difference of 0.010%), Slavic ($86,398, a difference of 0.020%), Moroccan ($86,468, a difference of 0.060%), Samoan ($86,498, a difference of 0.090%), and Immigrants from Albania ($86,534, a difference of 0.13%).
| Demographics | Rating | Rank | Median Household Income |
| South Americans | 75.1 /100 | #153 | Good $86,824 |
| Immigrants | Germany | 74.4 /100 | #154 | Good $86,764 |
| Carpatho Rusyns | 72.8 /100 | #155 | Good $86,635 |
| Immigrants | Albania | 71.5 /100 | #156 | Good $86,534 |
| Samoans | 71.0 /100 | #157 | Good $86,498 |
| Moroccans | 70.6 /100 | #158 | Good $86,468 |
| Immigrants | Uzbekistan | 70.1 /100 | #159 | Good $86,425 |
| Luxembourgers | 70.0 /100 | #160 | Good $86,418 |
| Slavs | 69.7 /100 | #161 | Good $86,398 |
| Guamanians/Chamorros | 67.7 /100 | #162 | Good $86,255 |
| Czechs | 66.4 /100 | #163 | Good $86,164 |
| Irish | 66.2 /100 | #164 | Good $86,145 |
| Norwegians | 65.3 /100 | #165 | Good $86,084 |
| Scandinavians | 65.1 /100 | #166 | Good $86,073 |
| Immigrants | Immigrants | 61.3 /100 | #167 | Good $85,818 |