Spanish American Indian vs Liberian Median Female Earnings
COMPARE
Spanish American Indian
Liberian
Median Female Earnings
Median Female Earnings Comparison
Spanish American Indians
Liberians
$33,625
MEDIAN FEMALE EARNINGS
0.0/ 100
METRIC RATING
334th/ 347
METRIC RANK
$38,215
MEDIAN FEMALE EARNINGS
4.4/ 100
METRIC RATING
236th/ 347
METRIC RANK
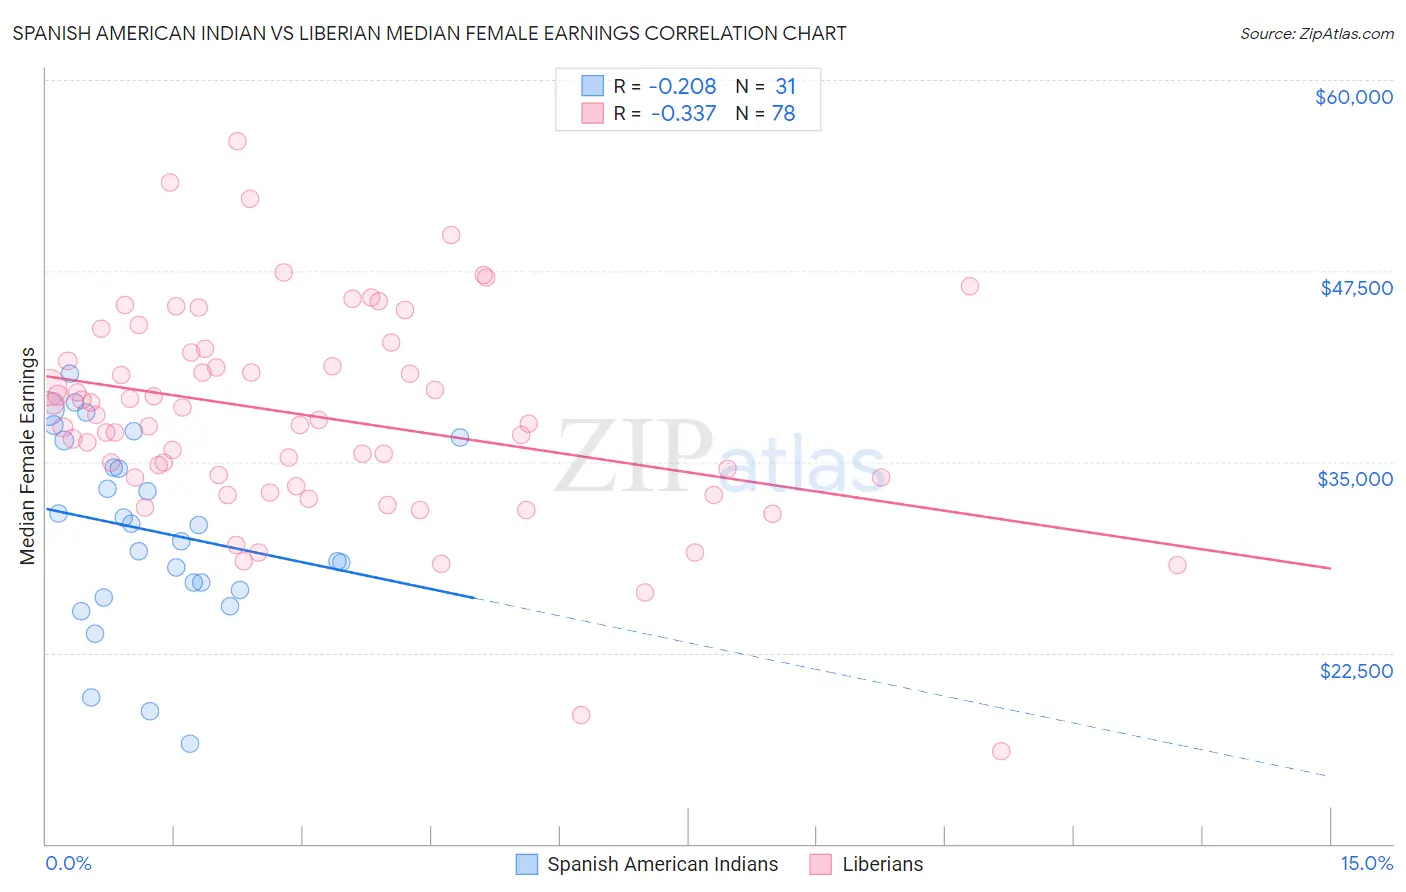
Spanish American Indian vs Liberian Median Female Earnings Correlation Chart
The statistical analysis conducted on geographies consisting of 73,144,962 people shows a weak negative correlation between the proportion of Spanish American Indians and median female earnings in the United States with a correlation coefficient (R) of -0.208 and weighted average of $33,625. Similarly, the statistical analysis conducted on geographies consisting of 118,095,616 people shows a mild negative correlation between the proportion of Liberians and median female earnings in the United States with a correlation coefficient (R) of -0.337 and weighted average of $38,215, a difference of 13.7%.
Median Female Earnings Correlation Summary
| Measurement | Spanish American Indian | Liberian |
| Minimum | $16,510 | $16,076 |
| Maximum | $40,753 | $56,012 |
| Range | $24,243 | $39,936 |
| Mean | $30,468 | $37,973 |
| Median | $30,907 | $37,624 |
| Interquartile 25% (IQ1) | $26,648 | $33,939 |
| Interquartile 75% (IQ3) | $36,401 | $42,173 |
| Interquartile Range (IQR) | $9,753 | $8,234 |
| Standard Deviation (Sample) | $6,157 | $6,991 |
| Standard Deviation (Population) | $6,057 | $6,946 |
Similar Demographics by Median Female Earnings
Demographics Similar to Spanish American Indians by Median Female Earnings
In terms of median female earnings, the demographic groups most similar to Spanish American Indians are Mexican ($33,664, a difference of 0.12%), Choctaw ($33,775, a difference of 0.45%), Native/Alaskan ($33,806, a difference of 0.54%), Creek ($33,437, a difference of 0.56%), and Ottawa ($33,378, a difference of 0.74%).
| Demographics | Rating | Rank | Median Female Earnings |
| Cajuns | 0.0 /100 | #327 | Tragic $34,034 |
| Immigrants | Central America | 0.0 /100 | #328 | Tragic $33,953 |
| Hopi | 0.0 /100 | #329 | Tragic $33,932 |
| Menominee | 0.0 /100 | #330 | Tragic $33,894 |
| Natives/Alaskans | 0.0 /100 | #331 | Tragic $33,806 |
| Choctaw | 0.0 /100 | #332 | Tragic $33,775 |
| Mexicans | 0.0 /100 | #333 | Tragic $33,664 |
| Spanish American Indians | 0.0 /100 | #334 | Tragic $33,625 |
| Creek | 0.0 /100 | #335 | Tragic $33,437 |
| Ottawa | 0.0 /100 | #336 | Tragic $33,378 |
| Yakama | 0.0 /100 | #337 | Tragic $33,354 |
| Immigrants | Cuba | 0.0 /100 | #338 | Tragic $33,291 |
| Immigrants | Mexico | 0.0 /100 | #339 | Tragic $33,236 |
| Tohono O'odham | 0.0 /100 | #340 | Tragic $33,205 |
| Navajo | 0.0 /100 | #341 | Tragic $33,046 |
Demographics Similar to Liberians by Median Female Earnings
In terms of median female earnings, the demographic groups most similar to Liberians are Sudanese ($38,215, a difference of 0.0%), Immigrants from Cabo Verde ($38,208, a difference of 0.020%), Alaska Native ($38,202, a difference of 0.030%), English ($38,196, a difference of 0.050%), and Finnish ($38,173, a difference of 0.11%).
| Demographics | Rating | Rank | Median Female Earnings |
| Belgians | 6.1 /100 | #229 | Tragic $38,382 |
| Basques | 5.7 /100 | #230 | Tragic $38,352 |
| Somalis | 5.5 /100 | #231 | Tragic $38,333 |
| Scandinavians | 5.2 /100 | #232 | Tragic $38,306 |
| Tongans | 5.1 /100 | #233 | Tragic $38,288 |
| Celtics | 5.0 /100 | #234 | Tragic $38,283 |
| Sudanese | 4.4 /100 | #235 | Tragic $38,215 |
| Liberians | 4.4 /100 | #236 | Tragic $38,215 |
| Immigrants | Cabo Verde | 4.3 /100 | #237 | Tragic $38,208 |
| Alaska Natives | 4.3 /100 | #238 | Tragic $38,202 |
| English | 4.2 /100 | #239 | Tragic $38,196 |
| Finns | 4.0 /100 | #240 | Tragic $38,173 |
| Spanish | 3.5 /100 | #241 | Tragic $38,098 |
| Immigrants | Burma/Myanmar | 3.0 /100 | #242 | Tragic $38,028 |
| Germans | 2.8 /100 | #243 | Tragic $37,986 |