Spaniard vs Immigrants from Kenya Unemployment Among Ages 60 to 64 years
COMPARE
Spaniard
Immigrants from Kenya
Unemployment Among Ages 60 to 64 years
Unemployment Among Ages 60 to 64 years Comparison
Spaniards
Immigrants from Kenya
4.9%
UNEMPLOYMENT AMONG AGES 60 TO 64 YEARS
35.8/ 100
METRIC RATING
186th/ 347
METRIC RANK
4.6%
UNEMPLOYMENT AMONG AGES 60 TO 64 YEARS
99.9/ 100
METRIC RATING
51st/ 347
METRIC RANK
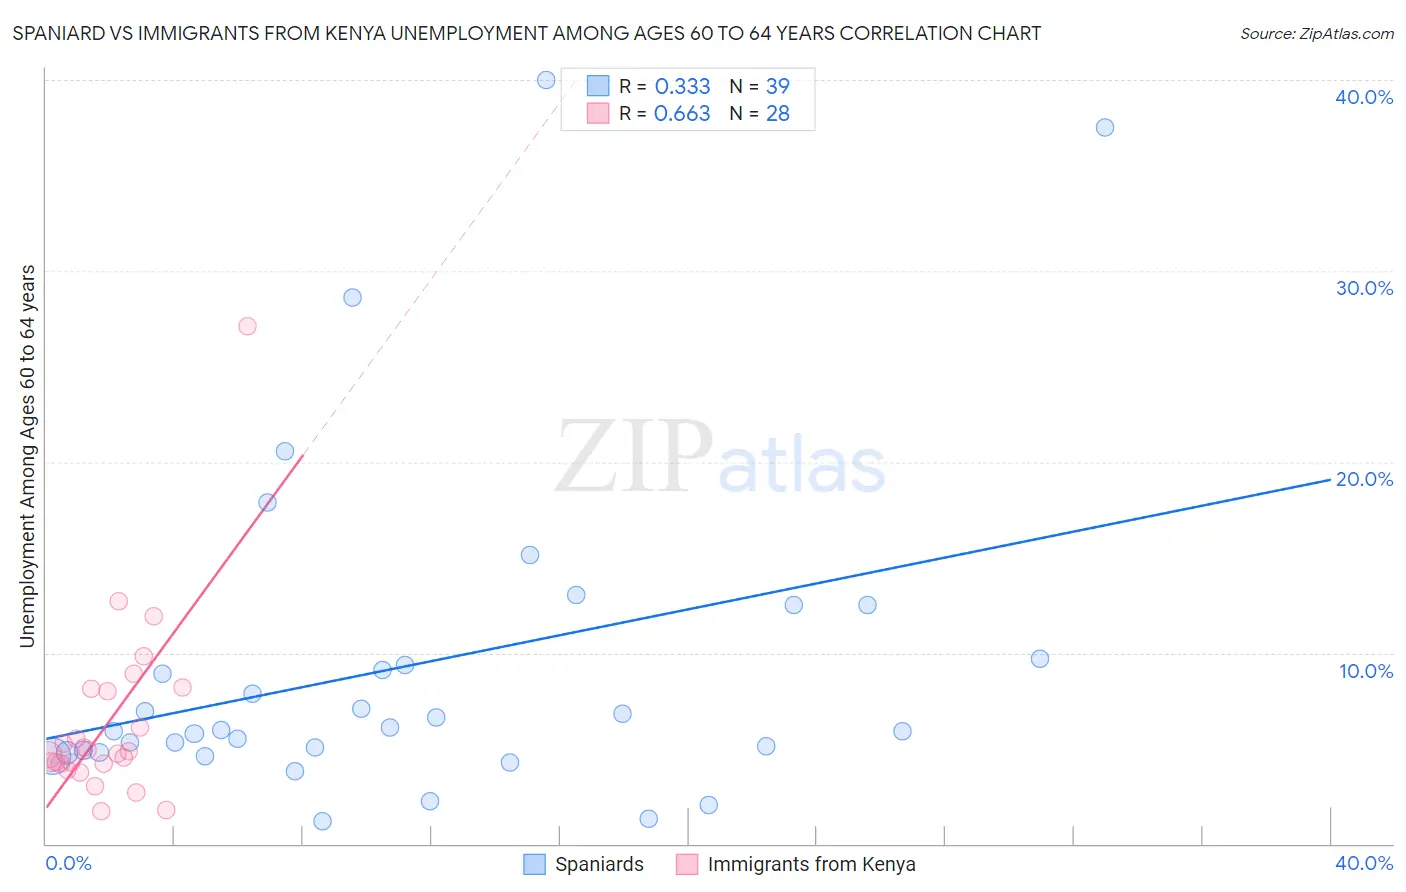
Spaniard vs Immigrants from Kenya Unemployment Among Ages 60 to 64 years Correlation Chart
The statistical analysis conducted on geographies consisting of 394,733,287 people shows a mild positive correlation between the proportion of Spaniards and unemployment rate among population between the ages 60 and 64 in the United States with a correlation coefficient (R) of 0.333 and weighted average of 4.9%. Similarly, the statistical analysis conducted on geographies consisting of 206,328,439 people shows a significant positive correlation between the proportion of Immigrants from Kenya and unemployment rate among population between the ages 60 and 64 in the United States with a correlation coefficient (R) of 0.663 and weighted average of 4.6%, a difference of 7.0%.
Unemployment Among Ages 60 to 64 years Correlation Summary
| Measurement | Spaniard | Immigrants from Kenya |
| Minimum | 1.2% | 1.7% |
| Maximum | 40.0% | 27.1% |
| Range | 38.8% | 25.4% |
| Mean | 9.3% | 6.4% |
| Median | 5.9% | 4.8% |
| Interquartile 25% (IQ1) | 4.8% | 4.2% |
| Interquartile 75% (IQ3) | 9.7% | 8.1% |
| Interquartile Range (IQR) | 4.9% | 3.9% |
| Standard Deviation (Sample) | 8.8% | 4.9% |
| Standard Deviation (Population) | 8.7% | 4.8% |
Similar Demographics by Unemployment Among Ages 60 to 64 years
Demographics Similar to Spaniards by Unemployment Among Ages 60 to 64 years
In terms of unemployment among ages 60 to 64 years, the demographic groups most similar to Spaniards are Ute (4.9%, a difference of 0.060%), Immigrants from Ukraine (4.9%, a difference of 0.070%), Subsaharan African (4.9%, a difference of 0.12%), Sri Lankan (4.9%, a difference of 0.15%), and Hungarian (4.9%, a difference of 0.18%).
| Demographics | Rating | Rank | Unemployment Among Ages 60 to 64 years |
| Immigrants | Sweden | 44.3 /100 | #179 | Average 4.9% |
| Asians | 40.8 /100 | #180 | Average 4.9% |
| Hungarians | 40.6 /100 | #181 | Average 4.9% |
| Sri Lankans | 39.8 /100 | #182 | Fair 4.9% |
| Sub-Saharan Africans | 38.9 /100 | #183 | Fair 4.9% |
| Immigrants | Ukraine | 37.6 /100 | #184 | Fair 4.9% |
| Ute | 37.4 /100 | #185 | Fair 4.9% |
| Spaniards | 35.8 /100 | #186 | Fair 4.9% |
| South American Indians | 31.2 /100 | #187 | Fair 4.9% |
| Nicaraguans | 30.4 /100 | #188 | Fair 4.9% |
| Immigrants | Nicaragua | 29.8 /100 | #189 | Fair 4.9% |
| Immigrants | Europe | 29.8 /100 | #190 | Fair 4.9% |
| Immigrants | Nigeria | 29.6 /100 | #191 | Fair 4.9% |
| Menominee | 28.8 /100 | #192 | Fair 4.9% |
| Houma | 28.3 /100 | #193 | Fair 4.9% |
Demographics Similar to Immigrants from Kenya by Unemployment Among Ages 60 to 64 years
In terms of unemployment among ages 60 to 64 years, the demographic groups most similar to Immigrants from Kenya are Kenyan (4.6%, a difference of 0.010%), Scottish (4.6%, a difference of 0.11%), Immigrants from Moldova (4.6%, a difference of 0.12%), Scotch-Irish (4.6%, a difference of 0.15%), and Dutch (4.6%, a difference of 0.15%).
| Demographics | Rating | Rank | Unemployment Among Ages 60 to 64 years |
| Europeans | 100.0 /100 | #44 | Exceptional 4.5% |
| Liberians | 99.9 /100 | #45 | Exceptional 4.5% |
| Bhutanese | 99.9 /100 | #46 | Exceptional 4.5% |
| Assyrians/Chaldeans/Syriacs | 99.9 /100 | #47 | Exceptional 4.5% |
| Immigrants | Zimbabwe | 99.9 /100 | #48 | Exceptional 4.6% |
| Scotch-Irish | 99.9 /100 | #49 | Exceptional 4.6% |
| Scottish | 99.9 /100 | #50 | Exceptional 4.6% |
| Immigrants | Kenya | 99.9 /100 | #51 | Exceptional 4.6% |
| Kenyans | 99.9 /100 | #52 | Exceptional 4.6% |
| Immigrants | Moldova | 99.9 /100 | #53 | Exceptional 4.6% |
| Dutch | 99.9 /100 | #54 | Exceptional 4.6% |
| Bangladeshis | 99.9 /100 | #55 | Exceptional 4.6% |
| Welsh | 99.9 /100 | #56 | Exceptional 4.6% |
| British | 99.9 /100 | #57 | Exceptional 4.6% |
| Immigrants | India | 99.8 /100 | #58 | Exceptional 4.6% |