Spaniard vs Immigrants from Greece Householder Income Over 65 years
COMPARE
Spaniard
Immigrants from Greece
Householder Income Over 65 years
Householder Income Over 65 years Comparison
Spaniards
Immigrants from Greece
$60,866
HOUSEHOLDER INCOME OVER 65 YEARS
47.3/ 100
METRIC RATING
175th/ 347
METRIC RANK
$64,636
HOUSEHOLDER INCOME OVER 65 YEARS
97.9/ 100
METRIC RATING
84th/ 347
METRIC RANK
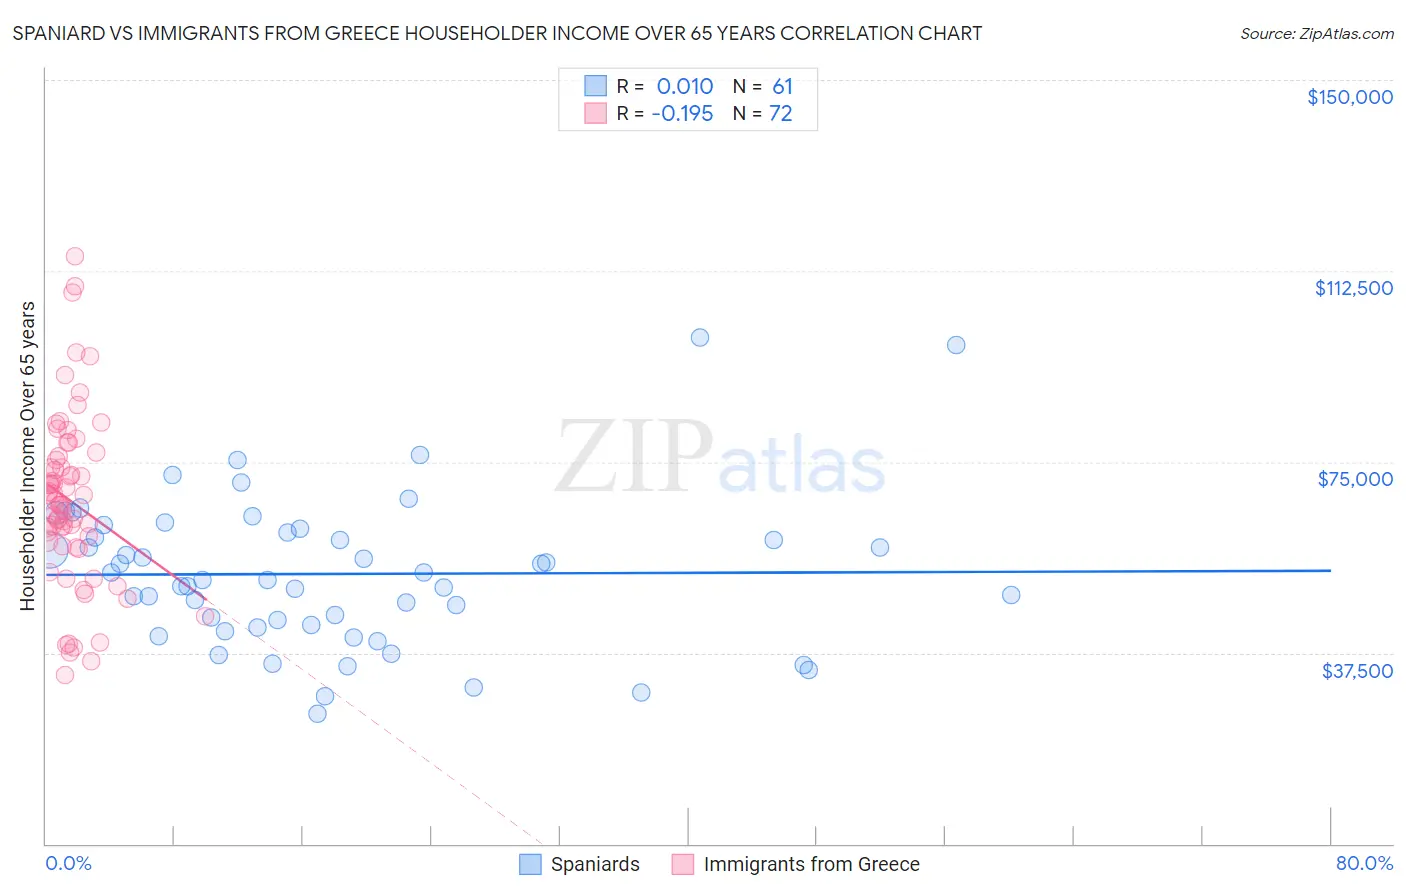
Spaniard vs Immigrants from Greece Householder Income Over 65 years Correlation Chart
The statistical analysis conducted on geographies consisting of 441,402,444 people shows no correlation between the proportion of Spaniards and household income with householder over the age of 65 in the United States with a correlation coefficient (R) of 0.010 and weighted average of $60,866. Similarly, the statistical analysis conducted on geographies consisting of 216,676,886 people shows a poor negative correlation between the proportion of Immigrants from Greece and household income with householder over the age of 65 in the United States with a correlation coefficient (R) of -0.195 and weighted average of $64,636, a difference of 6.2%.
Householder Income Over 65 years Correlation Summary
| Measurement | Spaniard | Immigrants from Greece |
| Minimum | $25,625 | $33,062 |
| Maximum | $99,316 | $115,263 |
| Range | $73,691 | $82,200 |
| Mean | $52,982 | $67,357 |
| Median | $51,848 | $66,928 |
| Interquartile 25% (IQ1) | $42,711 | $58,960 |
| Interquartile 75% (IQ3) | $61,532 | $75,732 |
| Interquartile Range (IQR) | $18,821 | $16,773 |
| Standard Deviation (Sample) | $14,647 | $16,859 |
| Standard Deviation (Population) | $14,526 | $16,741 |
Similar Demographics by Householder Income Over 65 years
Demographics Similar to Spaniards by Householder Income Over 65 years
In terms of householder income over 65 years, the demographic groups most similar to Spaniards are Spanish ($60,795, a difference of 0.12%), Luxembourger ($60,967, a difference of 0.17%), Alaska Native ($60,748, a difference of 0.19%), Immigrants from Micronesia ($61,000, a difference of 0.22%), and Yup'ik ($60,727, a difference of 0.23%).
| Demographics | Rating | Rank | Householder Income Over 65 years |
| Irish | 53.4 /100 | #168 | Average $61,097 |
| Carpatho Rusyns | 53.3 /100 | #169 | Average $61,093 |
| Serbians | 53.1 /100 | #170 | Average $61,087 |
| Inupiat | 52.4 /100 | #171 | Average $61,061 |
| Immigrants | Poland | 51.9 /100 | #172 | Average $61,041 |
| Immigrants | Micronesia | 50.8 /100 | #173 | Average $61,000 |
| Luxembourgers | 50.0 /100 | #174 | Average $60,967 |
| Spaniards | 47.3 /100 | #175 | Average $60,866 |
| Spanish | 45.5 /100 | #176 | Average $60,795 |
| Alaska Natives | 44.3 /100 | #177 | Average $60,748 |
| Yup'ik | 43.7 /100 | #178 | Average $60,727 |
| Welsh | 42.2 /100 | #179 | Average $60,666 |
| Immigrants | Morocco | 41.7 /100 | #180 | Average $60,647 |
| Celtics | 40.7 /100 | #181 | Average $60,608 |
| Czechoslovakians | 40.0 /100 | #182 | Average $60,581 |
Demographics Similar to Immigrants from Greece by Householder Income Over 65 years
In terms of householder income over 65 years, the demographic groups most similar to Immigrants from Greece are Northern European ($64,658, a difference of 0.030%), Immigrants from Lebanon ($64,521, a difference of 0.18%), Immigrants from Russia ($64,512, a difference of 0.19%), Immigrants from Fiji ($64,795, a difference of 0.25%), and Austrian ($64,470, a difference of 0.26%).
| Demographics | Rating | Rank | Householder Income Over 65 years |
| Immigrants | Canada | 98.5 /100 | #77 | Exceptional $64,952 |
| Immigrants | Western Europe | 98.5 /100 | #78 | Exceptional $64,933 |
| Hawaiians | 98.4 /100 | #79 | Exceptional $64,920 |
| Immigrants | North America | 98.3 /100 | #80 | Exceptional $64,856 |
| Immigrants | Europe | 98.3 /100 | #81 | Exceptional $64,828 |
| Immigrants | Fiji | 98.2 /100 | #82 | Exceptional $64,795 |
| Northern Europeans | 97.9 /100 | #83 | Exceptional $64,658 |
| Immigrants | Greece | 97.9 /100 | #84 | Exceptional $64,636 |
| Immigrants | Lebanon | 97.6 /100 | #85 | Exceptional $64,521 |
| Immigrants | Russia | 97.6 /100 | #86 | Exceptional $64,512 |
| Austrians | 97.5 /100 | #87 | Exceptional $64,470 |
| Immigrants | Romania | 97.5 /100 | #88 | Exceptional $64,462 |
| Paraguayans | 97.4 /100 | #89 | Exceptional $64,443 |
| Immigrants | Kuwait | 97.4 /100 | #90 | Exceptional $64,433 |
| Immigrants | Oceania | 97.4 /100 | #91 | Exceptional $64,416 |