South American vs Sri Lankan Householder Income Ages 25 - 44 years
COMPARE
South American
Sri Lankan
Householder Income Ages 25 - 44 years
Householder Income Ages 25 - 44 years Comparison
South Americans
Sri Lankans
$95,362
HOUSEHOLDER INCOME AGES 25 - 44 YEARS
60.9/ 100
METRIC RATING
164th/ 347
METRIC RANK
$101,960
HOUSEHOLDER INCOME AGES 25 - 44 YEARS
98.4/ 100
METRIC RATING
94th/ 347
METRIC RANK
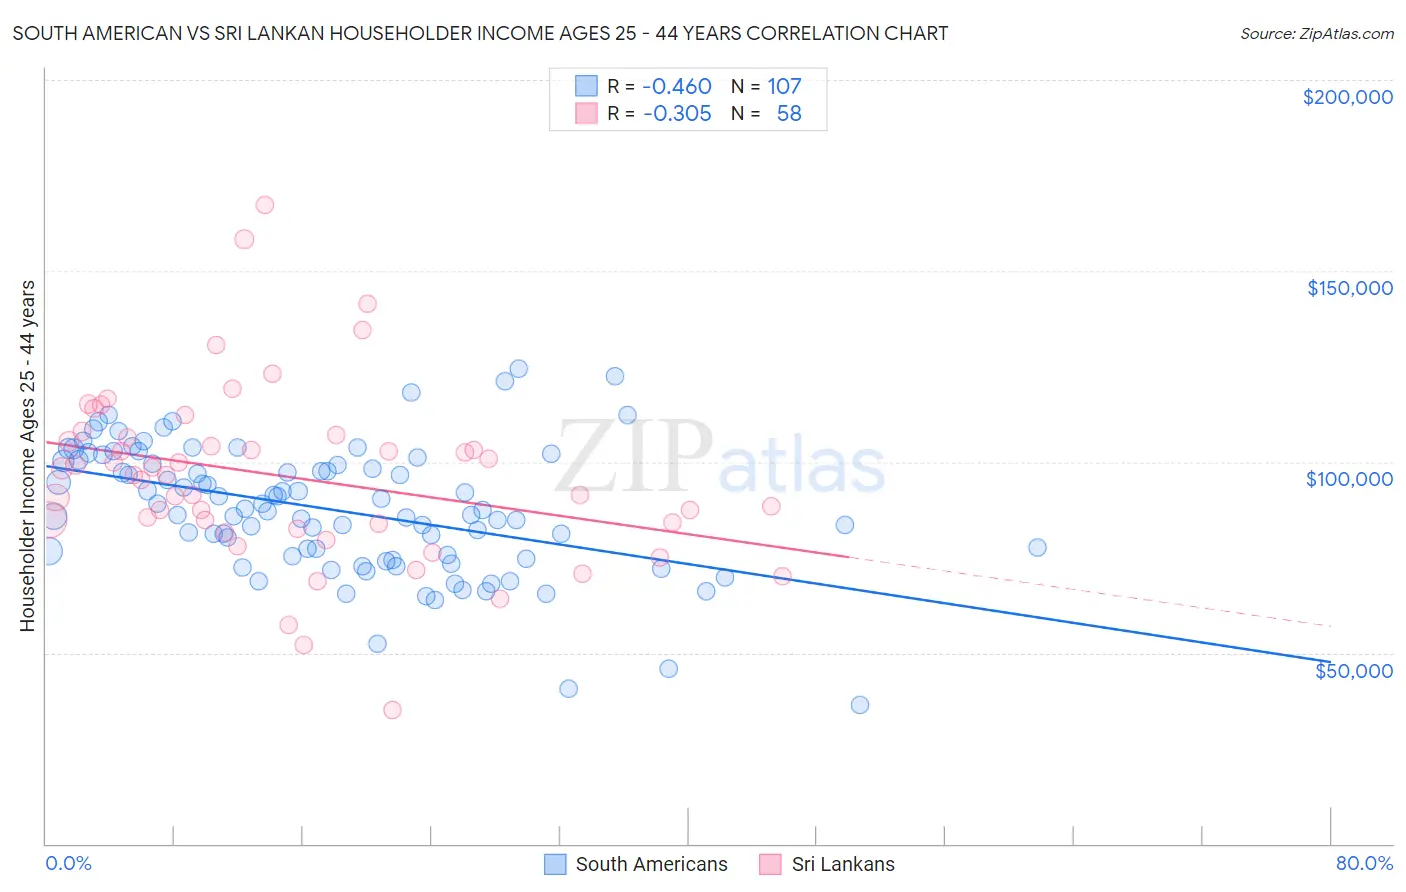
South American vs Sri Lankan Householder Income Ages 25 - 44 years Correlation Chart
The statistical analysis conducted on geographies consisting of 492,106,064 people shows a moderate negative correlation between the proportion of South Americans and household income with householder between the ages 25 and 44 in the United States with a correlation coefficient (R) of -0.460 and weighted average of $95,362. Similarly, the statistical analysis conducted on geographies consisting of 439,036,637 people shows a mild negative correlation between the proportion of Sri Lankans and household income with householder between the ages 25 and 44 in the United States with a correlation coefficient (R) of -0.305 and weighted average of $101,960, a difference of 6.9%.
Householder Income Ages 25 - 44 years Correlation Summary
| Measurement | South American | Sri Lankan |
| Minimum | $36,176 | $35,156 |
| Maximum | $124,375 | $167,132 |
| Range | $88,199 | $131,976 |
| Mean | $87,458 | $96,155 |
| Median | $87,265 | $96,605 |
| Interquartile 25% (IQ1) | $75,189 | $83,833 |
| Interquartile 75% (IQ3) | $100,291 | $106,327 |
| Interquartile Range (IQR) | $25,102 | $22,494 |
| Standard Deviation (Sample) | $16,777 | $23,383 |
| Standard Deviation (Population) | $16,698 | $23,180 |
Similar Demographics by Householder Income Ages 25 - 44 years
Demographics Similar to South Americans by Householder Income Ages 25 - 44 years
In terms of householder income ages 25 - 44 years, the demographic groups most similar to South Americans are Immigrants from Nepal ($95,322, a difference of 0.040%), Immigrants from Saudi Arabia ($95,450, a difference of 0.090%), Immigrants from Ethiopia ($95,256, a difference of 0.11%), Immigrants from Portugal ($95,512, a difference of 0.16%), and Swiss ($95,511, a difference of 0.16%).
| Demographics | Rating | Rank | Householder Income Ages 25 - 44 years |
| Immigrants | Uganda | 65.2 /100 | #157 | Good $95,698 |
| Scandinavians | 63.9 /100 | #158 | Good $95,596 |
| Costa Ricans | 63.5 /100 | #159 | Good $95,565 |
| Icelanders | 63.4 /100 | #160 | Good $95,560 |
| Immigrants | Portugal | 62.8 /100 | #161 | Good $95,512 |
| Swiss | 62.8 /100 | #162 | Good $95,511 |
| Immigrants | Saudi Arabia | 62.0 /100 | #163 | Good $95,450 |
| South Americans | 60.9 /100 | #164 | Good $95,362 |
| Immigrants | Nepal | 60.3 /100 | #165 | Good $95,322 |
| Immigrants | Ethiopia | 59.5 /100 | #166 | Average $95,256 |
| Czechoslovakians | 57.0 /100 | #167 | Average $95,070 |
| Alsatians | 56.8 /100 | #168 | Average $95,059 |
| Native Hawaiians | 56.8 /100 | #169 | Average $95,058 |
| Slovaks | 56.4 /100 | #170 | Average $95,032 |
| Immigrants | Armenia | 54.2 /100 | #171 | Average $94,867 |
Demographics Similar to Sri Lankans by Householder Income Ages 25 - 44 years
In terms of householder income ages 25 - 44 years, the demographic groups most similar to Sri Lankans are Assyrian/Chaldean/Syriac ($101,936, a difference of 0.020%), Immigrants from England ($102,020, a difference of 0.060%), Macedonian ($101,882, a difference of 0.080%), Austrian ($101,842, a difference of 0.12%), and Immigrants from Kazakhstan ($101,727, a difference of 0.23%).
| Demographics | Rating | Rank | Householder Income Ages 25 - 44 years |
| Immigrants | Western Europe | 98.9 /100 | #87 | Exceptional $102,654 |
| Immigrants | Canada | 98.9 /100 | #88 | Exceptional $102,616 |
| Romanians | 98.8 /100 | #89 | Exceptional $102,544 |
| Ukrainians | 98.8 /100 | #90 | Exceptional $102,451 |
| Croatians | 98.7 /100 | #91 | Exceptional $102,414 |
| Immigrants | North America | 98.7 /100 | #92 | Exceptional $102,407 |
| Immigrants | England | 98.4 /100 | #93 | Exceptional $102,020 |
| Sri Lankans | 98.4 /100 | #94 | Exceptional $101,960 |
| Assyrians/Chaldeans/Syriacs | 98.3 /100 | #95 | Exceptional $101,936 |
| Macedonians | 98.3 /100 | #96 | Exceptional $101,882 |
| Austrians | 98.3 /100 | #97 | Exceptional $101,842 |
| Immigrants | Kazakhstan | 98.1 /100 | #98 | Exceptional $101,727 |
| Taiwanese | 97.9 /100 | #99 | Exceptional $101,492 |
| Immigrants | Argentina | 97.8 /100 | #100 | Exceptional $101,415 |
| Albanians | 97.8 /100 | #101 | Exceptional $101,367 |