South American vs Immigrants from Micronesia Householder Income Ages 25 - 44 years
COMPARE
South American
Immigrants from Micronesia
Householder Income Ages 25 - 44 years
Householder Income Ages 25 - 44 years Comparison
South Americans
Immigrants from Micronesia
$95,362
HOUSEHOLDER INCOME AGES 25 - 44 YEARS
60.9/ 100
METRIC RATING
164th/ 347
METRIC RANK
$80,544
HOUSEHOLDER INCOME AGES 25 - 44 YEARS
0.0/ 100
METRIC RATING
301st/ 347
METRIC RANK
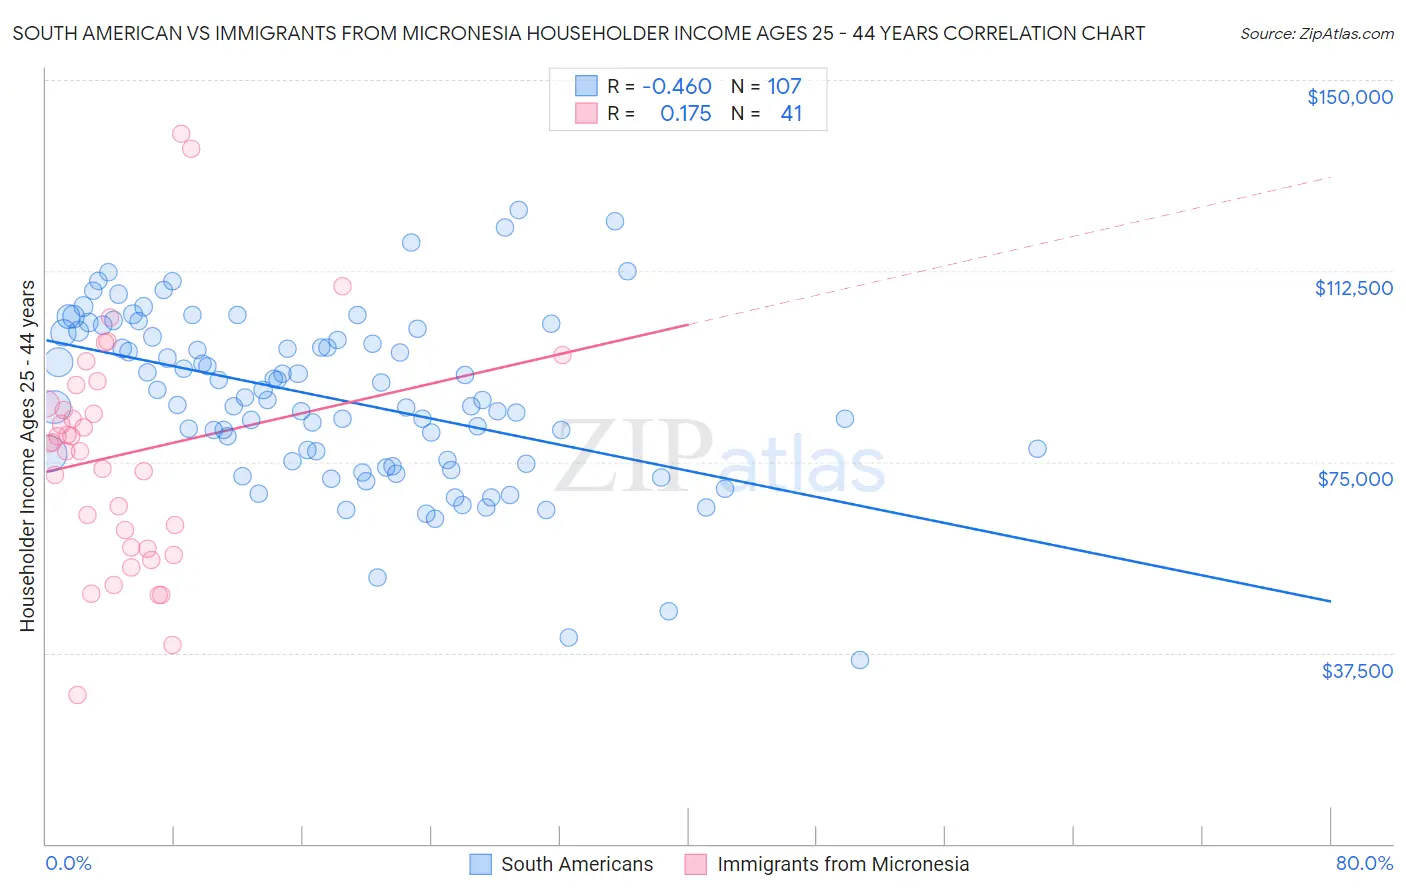
South American vs Immigrants from Micronesia Householder Income Ages 25 - 44 years Correlation Chart
The statistical analysis conducted on geographies consisting of 492,106,064 people shows a moderate negative correlation between the proportion of South Americans and household income with householder between the ages 25 and 44 in the United States with a correlation coefficient (R) of -0.460 and weighted average of $95,362. Similarly, the statistical analysis conducted on geographies consisting of 61,580,291 people shows a poor positive correlation between the proportion of Immigrants from Micronesia and household income with householder between the ages 25 and 44 in the United States with a correlation coefficient (R) of 0.175 and weighted average of $80,544, a difference of 18.4%.
Householder Income Ages 25 - 44 years Correlation Summary
| Measurement | South American | Immigrants from Micronesia |
| Minimum | $36,176 | $29,188 |
| Maximum | $124,375 | $139,375 |
| Range | $88,199 | $110,187 |
| Mean | $87,458 | $76,482 |
| Median | $87,265 | $78,666 |
| Interquartile 25% (IQ1) | $75,189 | $58,006 |
| Interquartile 75% (IQ3) | $100,291 | $88,259 |
| Interquartile Range (IQR) | $25,102 | $30,252 |
| Standard Deviation (Sample) | $16,777 | $22,989 |
| Standard Deviation (Population) | $16,698 | $22,707 |
Similar Demographics by Householder Income Ages 25 - 44 years
Demographics Similar to South Americans by Householder Income Ages 25 - 44 years
In terms of householder income ages 25 - 44 years, the demographic groups most similar to South Americans are Immigrants from Nepal ($95,322, a difference of 0.040%), Immigrants from Saudi Arabia ($95,450, a difference of 0.090%), Immigrants from Ethiopia ($95,256, a difference of 0.11%), Immigrants from Portugal ($95,512, a difference of 0.16%), and Swiss ($95,511, a difference of 0.16%).
| Demographics | Rating | Rank | Householder Income Ages 25 - 44 years |
| Immigrants | Uganda | 65.2 /100 | #157 | Good $95,698 |
| Scandinavians | 63.9 /100 | #158 | Good $95,596 |
| Costa Ricans | 63.5 /100 | #159 | Good $95,565 |
| Icelanders | 63.4 /100 | #160 | Good $95,560 |
| Immigrants | Portugal | 62.8 /100 | #161 | Good $95,512 |
| Swiss | 62.8 /100 | #162 | Good $95,511 |
| Immigrants | Saudi Arabia | 62.0 /100 | #163 | Good $95,450 |
| South Americans | 60.9 /100 | #164 | Good $95,362 |
| Immigrants | Nepal | 60.3 /100 | #165 | Good $95,322 |
| Immigrants | Ethiopia | 59.5 /100 | #166 | Average $95,256 |
| Czechoslovakians | 57.0 /100 | #167 | Average $95,070 |
| Alsatians | 56.8 /100 | #168 | Average $95,059 |
| Native Hawaiians | 56.8 /100 | #169 | Average $95,058 |
| Slovaks | 56.4 /100 | #170 | Average $95,032 |
| Immigrants | Armenia | 54.2 /100 | #171 | Average $94,867 |
Demographics Similar to Immigrants from Micronesia by Householder Income Ages 25 - 44 years
In terms of householder income ages 25 - 44 years, the demographic groups most similar to Immigrants from Micronesia are Hispanic or Latino ($80,515, a difference of 0.040%), Mexican ($80,427, a difference of 0.14%), Immigrants from Caribbean ($80,326, a difference of 0.27%), Immigrants from Dominican Republic ($80,319, a difference of 0.28%), and Apache ($80,260, a difference of 0.35%).
| Demographics | Rating | Rank | Householder Income Ages 25 - 44 years |
| Cubans | 0.1 /100 | #294 | Tragic $81,483 |
| Bangladeshis | 0.1 /100 | #295 | Tragic $81,363 |
| Immigrants | Dominica | 0.1 /100 | #296 | Tragic $81,351 |
| Immigrants | Guatemala | 0.1 /100 | #297 | Tragic $81,341 |
| Dominicans | 0.1 /100 | #298 | Tragic $81,229 |
| Immigrants | Liberia | 0.1 /100 | #299 | Tragic $80,863 |
| Cherokee | 0.0 /100 | #300 | Tragic $80,843 |
| Immigrants | Micronesia | 0.0 /100 | #301 | Tragic $80,544 |
| Hispanics or Latinos | 0.0 /100 | #302 | Tragic $80,515 |
| Mexicans | 0.0 /100 | #303 | Tragic $80,427 |
| Immigrants | Caribbean | 0.0 /100 | #304 | Tragic $80,326 |
| Immigrants | Dominican Republic | 0.0 /100 | #305 | Tragic $80,319 |
| Apache | 0.0 /100 | #306 | Tragic $80,260 |
| Haitians | 0.0 /100 | #307 | Tragic $80,055 |
| Immigrants | Central America | 0.0 /100 | #308 | Tragic $80,012 |