South American vs Yup'ik Householder Income Ages 45 - 64 years
COMPARE
South American
Yup'ik
Householder Income Ages 45 - 64 years
Householder Income Ages 45 - 64 years Comparison
South Americans
Yup'ik
$100,837
HOUSEHOLDER INCOME AGES 45 - 64 YEARS
56.4/ 100
METRIC RATING
171st/ 347
METRIC RANK
$81,000
HOUSEHOLDER INCOME AGES 45 - 64 YEARS
0.0/ 100
METRIC RATING
324th/ 347
METRIC RANK
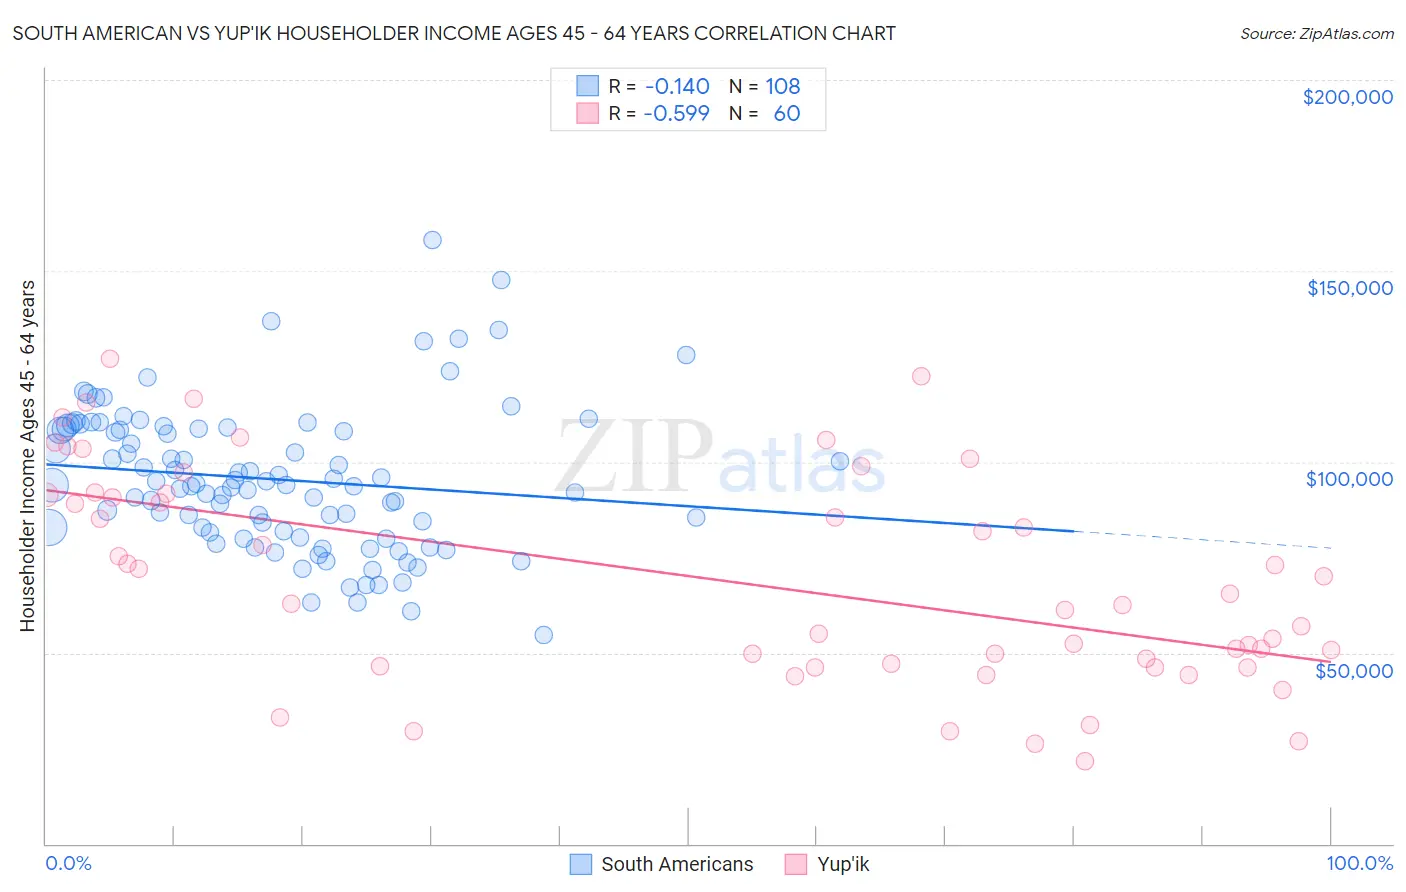
South American vs Yup'ik Householder Income Ages 45 - 64 years Correlation Chart
The statistical analysis conducted on geographies consisting of 492,624,098 people shows a poor negative correlation between the proportion of South Americans and household income with householder between the ages 45 and 64 in the United States with a correlation coefficient (R) of -0.140 and weighted average of $100,837. Similarly, the statistical analysis conducted on geographies consisting of 39,943,055 people shows a substantial negative correlation between the proportion of Yup'ik and household income with householder between the ages 45 and 64 in the United States with a correlation coefficient (R) of -0.599 and weighted average of $81,000, a difference of 24.5%.
Householder Income Ages 45 - 64 years Correlation Summary
| Measurement | South American | Yup'ik |
| Minimum | $54,659 | $21,563 |
| Maximum | $158,009 | $127,108 |
| Range | $103,350 | $105,545 |
| Mean | $95,419 | $69,372 |
| Median | $93,921 | $64,271 |
| Interquartile 25% (IQ1) | $81,601 | $46,840 |
| Interquartile 75% (IQ3) | $108,663 | $91,495 |
| Interquartile Range (IQR) | $27,062 | $44,656 |
| Standard Deviation (Sample) | $18,909 | $27,859 |
| Standard Deviation (Population) | $18,822 | $27,626 |
Similar Demographics by Householder Income Ages 45 - 64 years
Demographics Similar to South Americans by Householder Income Ages 45 - 64 years
In terms of householder income ages 45 - 64 years, the demographic groups most similar to South Americans are Slovak ($101,029, a difference of 0.19%), Immigrants from Uzbekistan ($100,523, a difference of 0.31%), South American Indian ($101,171, a difference of 0.33%), Guamanian/Chamorro ($101,170, a difference of 0.33%), and Alsatian ($100,435, a difference of 0.40%).
| Demographics | Rating | Rank | Householder Income Ages 45 - 64 years |
| Immigrants | Morocco | 70.0 /100 | #164 | Good $102,015 |
| Immigrants | Albania | 69.4 /100 | #165 | Good $101,957 |
| Samoans | 65.3 /100 | #166 | Good $101,580 |
| Czechoslovakians | 63.0 /100 | #167 | Good $101,387 |
| South American Indians | 60.5 /100 | #168 | Good $101,171 |
| Guamanians/Chamorros | 60.5 /100 | #169 | Good $101,170 |
| Slovaks | 58.8 /100 | #170 | Average $101,029 |
| South Americans | 56.4 /100 | #171 | Average $100,837 |
| Immigrants | Uzbekistan | 52.5 /100 | #172 | Average $100,523 |
| Alsatians | 51.4 /100 | #173 | Average $100,435 |
| Welsh | 50.0 /100 | #174 | Average $100,322 |
| Germans | 48.8 /100 | #175 | Average $100,224 |
| Immigrants | Costa Rica | 47.7 /100 | #176 | Average $100,141 |
| Moroccans | 47.7 /100 | #177 | Average $100,138 |
| Immigrants | Cameroon | 47.0 /100 | #178 | Average $100,084 |
Demographics Similar to Yup'ik by Householder Income Ages 45 - 64 years
In terms of householder income ages 45 - 64 years, the demographic groups most similar to Yup'ik are Immigrants from Cuba ($80,662, a difference of 0.42%), Bahamian ($81,369, a difference of 0.46%), Dominican ($80,623, a difference of 0.47%), Sioux ($81,750, a difference of 0.93%), and Seminole ($80,077, a difference of 1.1%).
| Demographics | Rating | Rank | Householder Income Ages 45 - 64 years |
| Colville | 0.0 /100 | #317 | Tragic $82,474 |
| Choctaw | 0.0 /100 | #318 | Tragic $82,287 |
| Chickasaw | 0.0 /100 | #319 | Tragic $82,193 |
| Apache | 0.0 /100 | #320 | Tragic $82,184 |
| Yuman | 0.0 /100 | #321 | Tragic $82,139 |
| Sioux | 0.0 /100 | #322 | Tragic $81,750 |
| Bahamians | 0.0 /100 | #323 | Tragic $81,369 |
| Yup'ik | 0.0 /100 | #324 | Tragic $81,000 |
| Immigrants | Cuba | 0.0 /100 | #325 | Tragic $80,662 |
| Dominicans | 0.0 /100 | #326 | Tragic $80,623 |
| Seminole | 0.0 /100 | #327 | Tragic $80,077 |
| Natives/Alaskans | 0.0 /100 | #328 | Tragic $79,816 |
| Dutch West Indians | 0.0 /100 | #329 | Tragic $79,171 |
| Creek | 0.0 /100 | #330 | Tragic $78,960 |
| Immigrants | Dominican Republic | 0.0 /100 | #331 | Tragic $78,836 |