South American Indian vs Iraqi Householder Income Ages 45 - 64 years
COMPARE
South American Indian
Iraqi
Householder Income Ages 45 - 64 years
Householder Income Ages 45 - 64 years Comparison
South American Indians
Iraqis
$101,171
HOUSEHOLDER INCOME AGES 45 - 64 YEARS
60.5/ 100
METRIC RATING
168th/ 347
METRIC RANK
$99,387
HOUSEHOLDER INCOME AGES 45 - 64 YEARS
38.5/ 100
METRIC RATING
187th/ 347
METRIC RANK
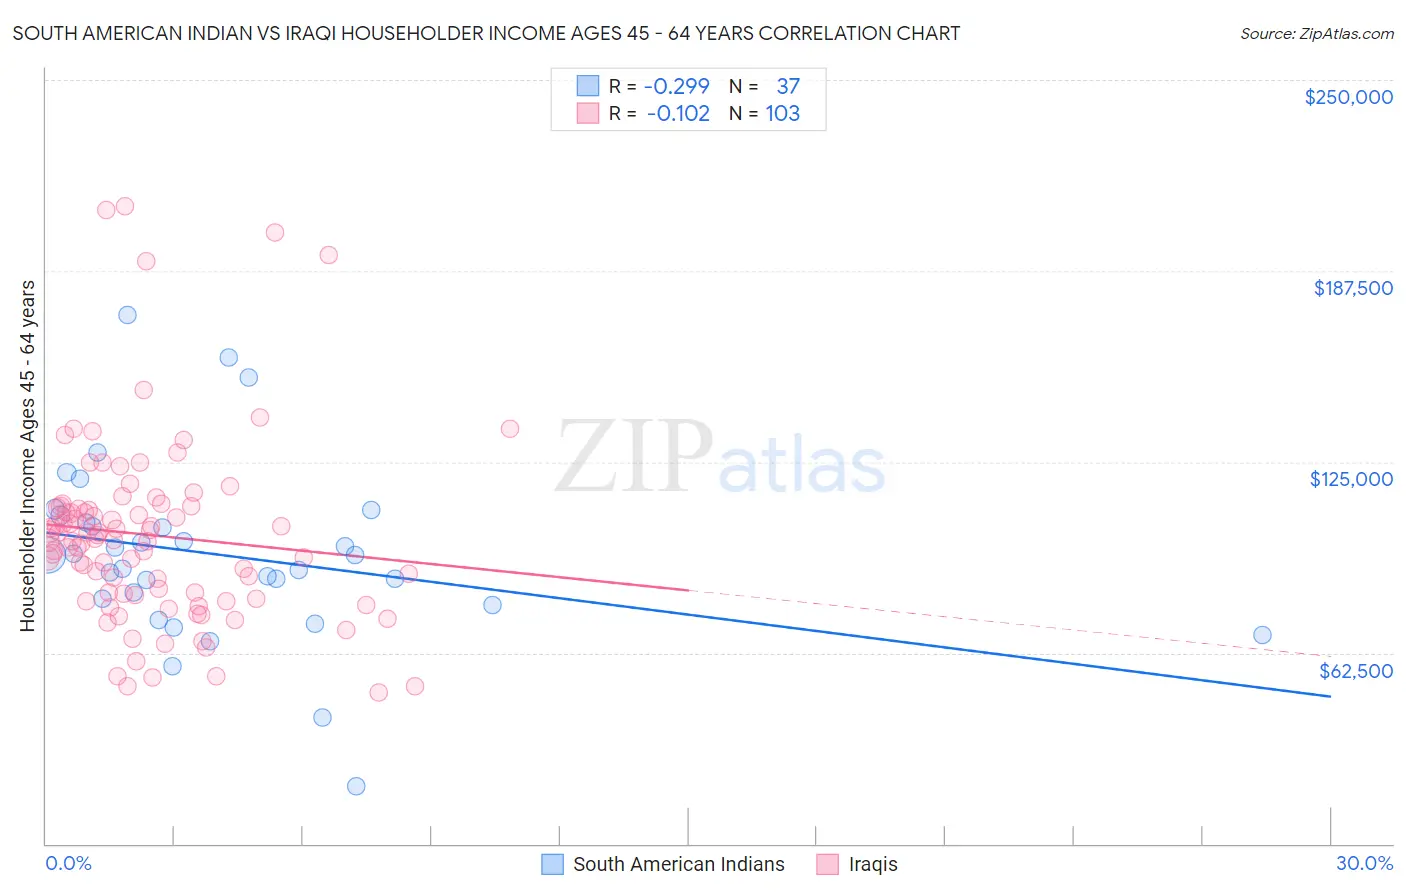
South American Indian vs Iraqi Householder Income Ages 45 - 64 years Correlation Chart
The statistical analysis conducted on geographies consisting of 164,498,576 people shows a weak negative correlation between the proportion of South American Indians and household income with householder between the ages 45 and 64 in the United States with a correlation coefficient (R) of -0.299 and weighted average of $101,171. Similarly, the statistical analysis conducted on geographies consisting of 170,546,926 people shows a poor negative correlation between the proportion of Iraqis and household income with householder between the ages 45 and 64 in the United States with a correlation coefficient (R) of -0.102 and weighted average of $99,387, a difference of 1.8%.
Householder Income Ages 45 - 64 years Correlation Summary
| Measurement | South American Indian | Iraqi |
| Minimum | $18,682 | $49,554 |
| Maximum | $173,033 | $208,614 |
| Range | $154,351 | $159,060 |
| Mean | $94,461 | $101,029 |
| Median | $94,583 | $99,398 |
| Interquartile 25% (IQ1) | $79,132 | $81,325 |
| Interquartile 75% (IQ3) | $106,330 | $110,313 |
| Interquartile Range (IQR) | $27,199 | $28,988 |
| Standard Deviation (Sample) | $29,348 | $30,760 |
| Standard Deviation (Population) | $28,948 | $30,611 |
Demographics Similar to South American Indians and Iraqis by Householder Income Ages 45 - 64 years
In terms of householder income ages 45 - 64 years, the demographic groups most similar to South American Indians are Guamanian/Chamorro ($101,170, a difference of 0.0%), Slovak ($101,029, a difference of 0.14%), Czechoslovakian ($101,387, a difference of 0.21%), South American ($100,837, a difference of 0.33%), and Immigrants from Uzbekistan ($100,523, a difference of 0.64%). Similarly, the demographic groups most similar to Iraqis are Dutch ($99,650, a difference of 0.27%), Colombian ($99,772, a difference of 0.39%), French ($99,824, a difference of 0.44%), Spaniard ($99,889, a difference of 0.51%), and Finnish ($99,904, a difference of 0.52%).
| Demographics | Rating | Rank | Householder Income Ages 45 - 64 years |
| Czechoslovakians | 63.0 /100 | #167 | Good $101,387 |
| South American Indians | 60.5 /100 | #168 | Good $101,171 |
| Guamanians/Chamorros | 60.5 /100 | #169 | Good $101,170 |
| Slovaks | 58.8 /100 | #170 | Average $101,029 |
| South Americans | 56.4 /100 | #171 | Average $100,837 |
| Immigrants | Uzbekistan | 52.5 /100 | #172 | Average $100,523 |
| Alsatians | 51.4 /100 | #173 | Average $100,435 |
| Welsh | 50.0 /100 | #174 | Average $100,322 |
| Germans | 48.8 /100 | #175 | Average $100,224 |
| Immigrants | Costa Rica | 47.7 /100 | #176 | Average $100,141 |
| Moroccans | 47.7 /100 | #177 | Average $100,138 |
| Immigrants | Cameroon | 47.0 /100 | #178 | Average $100,084 |
| Belgians | 46.7 /100 | #179 | Average $100,060 |
| Aleuts | 46.6 /100 | #180 | Average $100,052 |
| Immigrants | Immigrants | 45.3 /100 | #181 | Average $99,943 |
| Finns | 44.8 /100 | #182 | Average $99,904 |
| Spaniards | 44.6 /100 | #183 | Average $99,889 |
| French | 43.8 /100 | #184 | Average $99,824 |
| Colombians | 43.2 /100 | #185 | Average $99,772 |
| Dutch | 41.7 /100 | #186 | Average $99,650 |
| Iraqis | 38.5 /100 | #187 | Fair $99,387 |