Immigrants from Saudi Arabia vs Iraqi Householder Income Ages 45 - 64 years
COMPARE
Immigrants from Saudi Arabia
Iraqi
Householder Income Ages 45 - 64 years
Householder Income Ages 45 - 64 years Comparison
Immigrants from Saudi Arabia
Iraqis
$105,249
HOUSEHOLDER INCOME AGES 45 - 64 YEARS
92.2/ 100
METRIC RATING
127th/ 347
METRIC RANK
$99,387
HOUSEHOLDER INCOME AGES 45 - 64 YEARS
38.5/ 100
METRIC RATING
187th/ 347
METRIC RANK
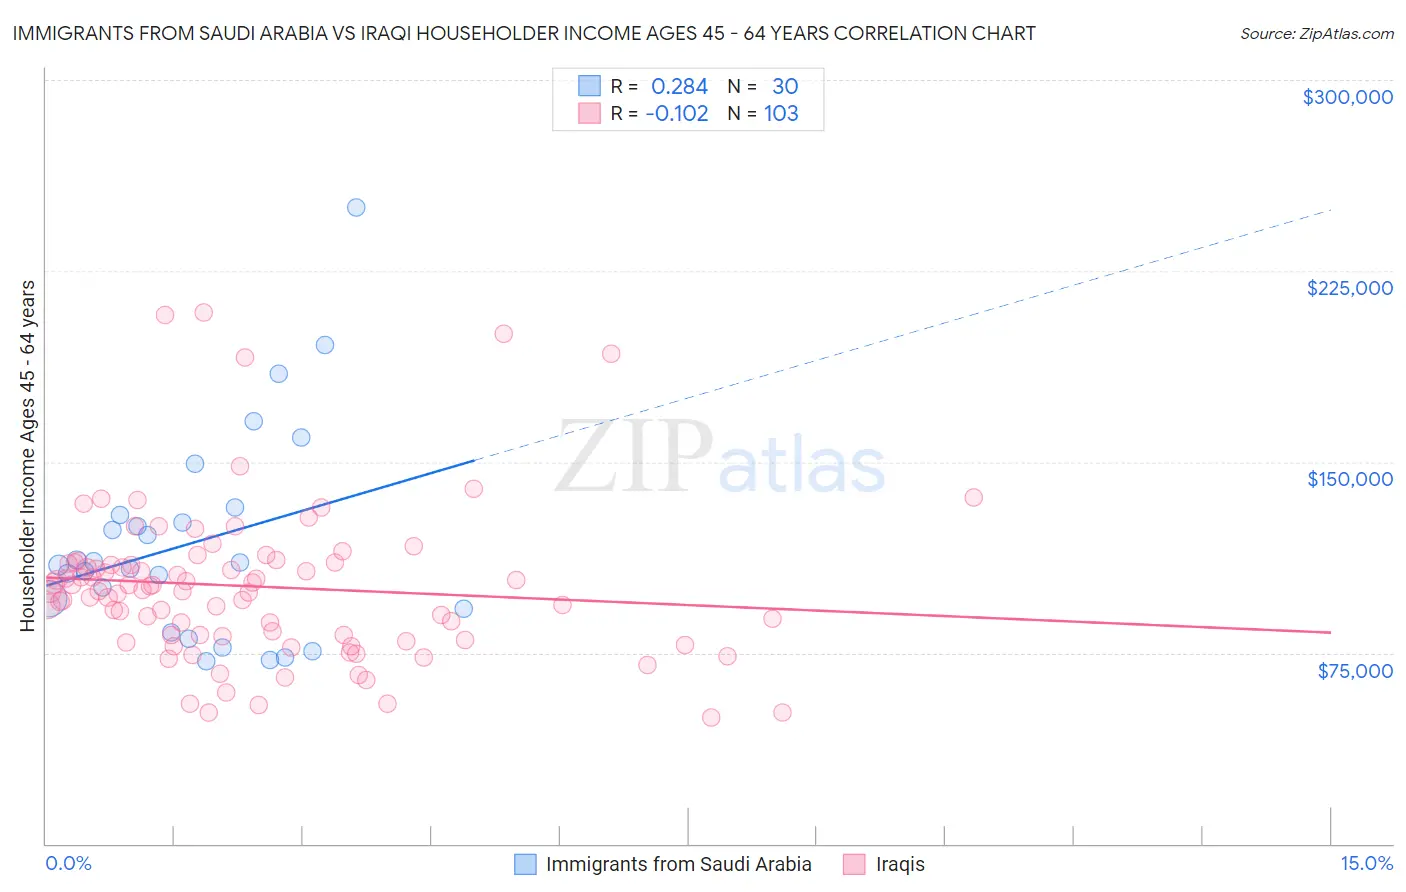
Immigrants from Saudi Arabia vs Iraqi Householder Income Ages 45 - 64 years Correlation Chart
The statistical analysis conducted on geographies consisting of 164,122,820 people shows a weak positive correlation between the proportion of Immigrants from Saudi Arabia and household income with householder between the ages 45 and 64 in the United States with a correlation coefficient (R) of 0.284 and weighted average of $105,249. Similarly, the statistical analysis conducted on geographies consisting of 170,546,926 people shows a poor negative correlation between the proportion of Iraqis and household income with householder between the ages 45 and 64 in the United States with a correlation coefficient (R) of -0.102 and weighted average of $99,387, a difference of 5.9%.
Householder Income Ages 45 - 64 years Correlation Summary
| Measurement | Immigrants from Saudi Arabia | Iraqi |
| Minimum | $71,471 | $49,554 |
| Maximum | $250,001 | $208,614 |
| Range | $178,530 | $159,060 |
| Mean | $118,389 | $101,029 |
| Median | $109,917 | $99,398 |
| Interquartile 25% (IQ1) | $92,091 | $81,325 |
| Interquartile 75% (IQ3) | $128,959 | $110,313 |
| Interquartile Range (IQR) | $36,868 | $28,988 |
| Standard Deviation (Sample) | $40,687 | $30,760 |
| Standard Deviation (Population) | $40,003 | $30,611 |
Similar Demographics by Householder Income Ages 45 - 64 years
Demographics Similar to Immigrants from Saudi Arabia by Householder Income Ages 45 - 64 years
In terms of householder income ages 45 - 64 years, the demographic groups most similar to Immigrants from Saudi Arabia are Pakistani ($105,317, a difference of 0.060%), Portuguese ($105,309, a difference of 0.060%), Native Hawaiian ($105,149, a difference of 0.090%), Immigrants from Northern Africa ($105,430, a difference of 0.17%), and Peruvian ($105,070, a difference of 0.17%).
| Demographics | Rating | Rank | Householder Income Ages 45 - 64 years |
| Immigrants | South Eastern Asia | 94.8 /100 | #120 | Exceptional $106,109 |
| Poles | 94.4 /100 | #121 | Exceptional $105,952 |
| Immigrants | North Macedonia | 94.2 /100 | #122 | Exceptional $105,892 |
| Danes | 93.4 /100 | #123 | Exceptional $105,619 |
| Immigrants | Northern Africa | 92.8 /100 | #124 | Exceptional $105,430 |
| Pakistanis | 92.4 /100 | #125 | Exceptional $105,317 |
| Portuguese | 92.4 /100 | #126 | Exceptional $105,309 |
| Immigrants | Saudi Arabia | 92.2 /100 | #127 | Exceptional $105,249 |
| Native Hawaiians | 91.8 /100 | #128 | Exceptional $105,149 |
| Peruvians | 91.5 /100 | #129 | Exceptional $105,070 |
| Immigrants | Zimbabwe | 91.2 /100 | #130 | Exceptional $104,992 |
| Immigrants | Syria | 90.7 /100 | #131 | Exceptional $104,858 |
| Lebanese | 90.1 /100 | #132 | Exceptional $104,734 |
| Arabs | 89.3 /100 | #133 | Excellent $104,566 |
| Canadians | 89.3 /100 | #134 | Excellent $104,560 |
Demographics Similar to Iraqis by Householder Income Ages 45 - 64 years
In terms of householder income ages 45 - 64 years, the demographic groups most similar to Iraqis are Immigrants from Portugal ($99,203, a difference of 0.19%), Immigrants from South America ($99,126, a difference of 0.26%), Dutch ($99,650, a difference of 0.27%), French Canadian ($99,093, a difference of 0.30%), and Colombian ($99,772, a difference of 0.39%).
| Demographics | Rating | Rank | Householder Income Ages 45 - 64 years |
| Aleuts | 46.6 /100 | #180 | Average $100,052 |
| Immigrants | Immigrants | 45.3 /100 | #181 | Average $99,943 |
| Finns | 44.8 /100 | #182 | Average $99,904 |
| Spaniards | 44.6 /100 | #183 | Average $99,889 |
| French | 43.8 /100 | #184 | Average $99,824 |
| Colombians | 43.2 /100 | #185 | Average $99,772 |
| Dutch | 41.7 /100 | #186 | Average $99,650 |
| Iraqis | 38.5 /100 | #187 | Fair $99,387 |
| Immigrants | Portugal | 36.3 /100 | #188 | Fair $99,203 |
| Immigrants | South America | 35.4 /100 | #189 | Fair $99,126 |
| French Canadians | 35.1 /100 | #190 | Fair $99,093 |
| Kenyans | 33.7 /100 | #191 | Fair $98,970 |
| Celtics | 32.9 /100 | #192 | Fair $98,896 |
| Hawaiians | 31.6 /100 | #193 | Fair $98,778 |
| Uruguayans | 30.3 /100 | #194 | Fair $98,660 |