South American Indian vs Immigrants from Armenia Householder Income Ages 45 - 64 years
COMPARE
South American Indian
Immigrants from Armenia
Householder Income Ages 45 - 64 years
Householder Income Ages 45 - 64 years Comparison
South American Indians
Immigrants from Armenia
$101,171
HOUSEHOLDER INCOME AGES 45 - 64 YEARS
60.5/ 100
METRIC RATING
168th/ 347
METRIC RANK
$94,863
HOUSEHOLDER INCOME AGES 45 - 64 YEARS
6.1/ 100
METRIC RATING
219th/ 347
METRIC RANK
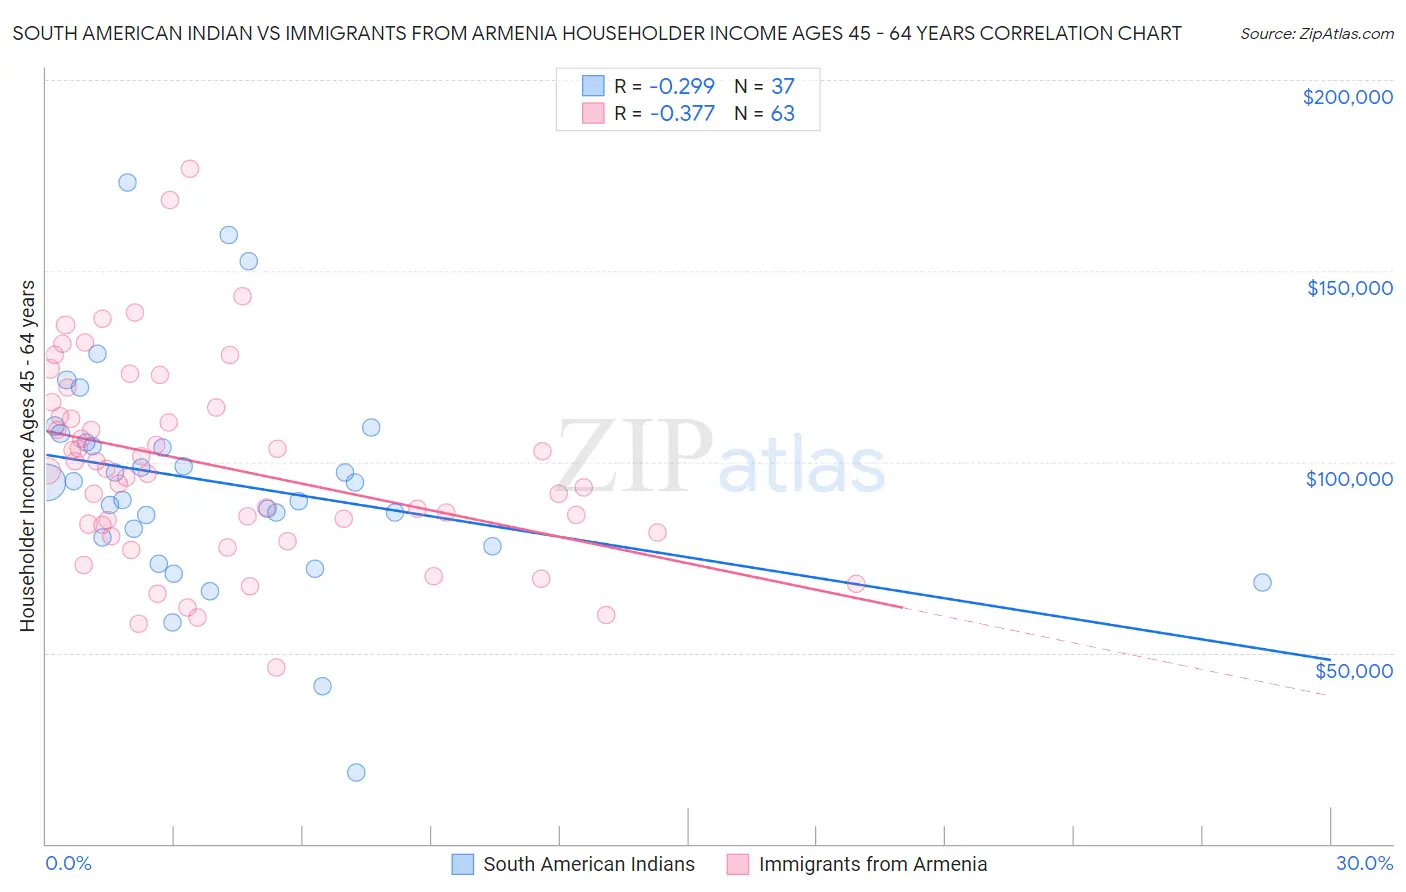
South American Indian vs Immigrants from Armenia Householder Income Ages 45 - 64 years Correlation Chart
The statistical analysis conducted on geographies consisting of 164,498,576 people shows a weak negative correlation between the proportion of South American Indians and household income with householder between the ages 45 and 64 in the United States with a correlation coefficient (R) of -0.299 and weighted average of $101,171. Similarly, the statistical analysis conducted on geographies consisting of 97,702,858 people shows a mild negative correlation between the proportion of Immigrants from Armenia and household income with householder between the ages 45 and 64 in the United States with a correlation coefficient (R) of -0.377 and weighted average of $94,863, a difference of 6.7%.
Householder Income Ages 45 - 64 years Correlation Summary
| Measurement | South American Indian | Immigrants from Armenia |
| Minimum | $18,682 | $46,250 |
| Maximum | $173,033 | $176,833 |
| Range | $154,351 | $130,583 |
| Mean | $94,461 | $99,033 |
| Median | $94,583 | $97,613 |
| Interquartile 25% (IQ1) | $79,132 | $81,563 |
| Interquartile 75% (IQ3) | $106,330 | $114,231 |
| Interquartile Range (IQR) | $27,199 | $32,668 |
| Standard Deviation (Sample) | $29,348 | $26,282 |
| Standard Deviation (Population) | $28,948 | $26,073 |
Similar Demographics by Householder Income Ages 45 - 64 years
Demographics Similar to South American Indians by Householder Income Ages 45 - 64 years
In terms of householder income ages 45 - 64 years, the demographic groups most similar to South American Indians are Guamanian/Chamorro ($101,170, a difference of 0.0%), Slovak ($101,029, a difference of 0.14%), Czechoslovakian ($101,387, a difference of 0.21%), South American ($100,837, a difference of 0.33%), and Samoan ($101,580, a difference of 0.40%).
| Demographics | Rating | Rank | Householder Income Ages 45 - 64 years |
| Immigrants | Nepal | 71.8 /100 | #161 | Good $102,190 |
| Scottish | 71.1 /100 | #162 | Good $102,123 |
| English | 70.1 /100 | #163 | Good $102,021 |
| Immigrants | Morocco | 70.0 /100 | #164 | Good $102,015 |
| Immigrants | Albania | 69.4 /100 | #165 | Good $101,957 |
| Samoans | 65.3 /100 | #166 | Good $101,580 |
| Czechoslovakians | 63.0 /100 | #167 | Good $101,387 |
| South American Indians | 60.5 /100 | #168 | Good $101,171 |
| Guamanians/Chamorros | 60.5 /100 | #169 | Good $101,170 |
| Slovaks | 58.8 /100 | #170 | Average $101,029 |
| South Americans | 56.4 /100 | #171 | Average $100,837 |
| Immigrants | Uzbekistan | 52.5 /100 | #172 | Average $100,523 |
| Alsatians | 51.4 /100 | #173 | Average $100,435 |
| Welsh | 50.0 /100 | #174 | Average $100,322 |
| Germans | 48.8 /100 | #175 | Average $100,224 |
Demographics Similar to Immigrants from Armenia by Householder Income Ages 45 - 64 years
In terms of householder income ages 45 - 64 years, the demographic groups most similar to Immigrants from Armenia are Salvadoran ($94,842, a difference of 0.020%), Delaware ($94,914, a difference of 0.050%), Immigrants from Nigeria ($94,804, a difference of 0.060%), Immigrants from Ghana ($94,982, a difference of 0.13%), and Malaysian ($94,517, a difference of 0.37%).
| Demographics | Rating | Rank | Householder Income Ages 45 - 64 years |
| Venezuelans | 12.6 /100 | #212 | Poor $96,460 |
| Immigrants | Uruguay | 10.7 /100 | #213 | Poor $96,086 |
| Panamanians | 10.6 /100 | #214 | Poor $96,066 |
| Nigerians | 8.2 /100 | #215 | Tragic $95,492 |
| Immigrants | Venezuela | 7.6 /100 | #216 | Tragic $95,342 |
| Immigrants | Ghana | 6.4 /100 | #217 | Tragic $94,982 |
| Delaware | 6.2 /100 | #218 | Tragic $94,914 |
| Immigrants | Armenia | 6.1 /100 | #219 | Tragic $94,863 |
| Salvadorans | 6.0 /100 | #220 | Tragic $94,842 |
| Immigrants | Nigeria | 5.9 /100 | #221 | Tragic $94,804 |
| Malaysians | 5.2 /100 | #222 | Tragic $94,517 |
| Immigrants | Nonimmigrants | 5.0 /100 | #223 | Tragic $94,448 |
| Immigrants | Bosnia and Herzegovina | 4.6 /100 | #224 | Tragic $94,288 |
| Bermudans | 4.4 /100 | #225 | Tragic $94,197 |
| Immigrants | Azores | 4.3 /100 | #226 | Tragic $94,138 |