South American Indian vs Iraqi Female Poverty Among 25-34 Year Olds
COMPARE
South American Indian
Iraqi
Female Poverty Among 25-34 Year Olds
Female Poverty Among 25-34 Year Olds Comparison
South American Indians
Iraqis
13.5%
FEMALE POVERTY AMONG 25-34 YEAR OLDS
51.9/ 100
METRIC RATING
171st/ 347
METRIC RANK
13.2%
FEMALE POVERTY AMONG 25-34 YEAR OLDS
76.0/ 100
METRIC RATING
150th/ 347
METRIC RANK
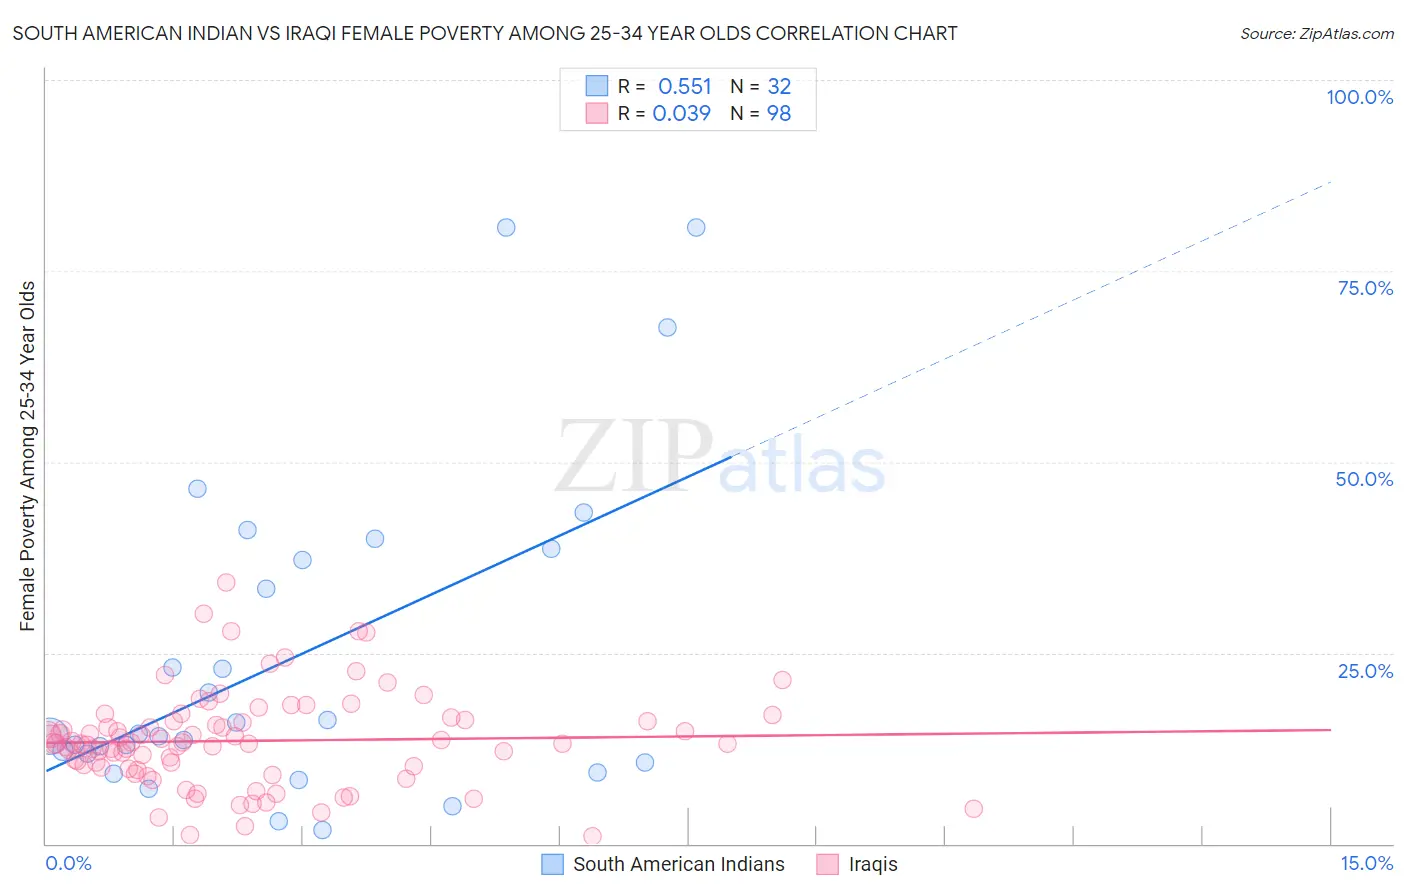
South American Indian vs Iraqi Female Poverty Among 25-34 Year Olds Correlation Chart
The statistical analysis conducted on geographies consisting of 163,669,571 people shows a substantial positive correlation between the proportion of South American Indians and poverty level among females between the ages 25 and 34 in the United States with a correlation coefficient (R) of 0.551 and weighted average of 13.5%. Similarly, the statistical analysis conducted on geographies consisting of 169,687,446 people shows no correlation between the proportion of Iraqis and poverty level among females between the ages 25 and 34 in the United States with a correlation coefficient (R) of 0.039 and weighted average of 13.2%, a difference of 2.3%.
Female Poverty Among 25-34 Year Olds Correlation Summary
| Measurement | South American Indian | Iraqi |
| Minimum | 1.7% | 0.91% |
| Maximum | 80.6% | 34.2% |
| Range | 78.9% | 33.3% |
| Mean | 24.4% | 13.5% |
| Median | 14.3% | 13.1% |
| Interquartile 25% (IQ1) | 11.2% | 9.9% |
| Interquartile 75% (IQ3) | 37.9% | 16.1% |
| Interquartile Range (IQR) | 26.6% | 6.2% |
| Standard Deviation (Sample) | 21.1% | 6.2% |
| Standard Deviation (Population) | 20.8% | 6.1% |
Similar Demographics by Female Poverty Among 25-34 Year Olds
Demographics Similar to South American Indians by Female Poverty Among 25-34 Year Olds
In terms of female poverty among 25-34 year olds, the demographic groups most similar to South American Indians are Immigrants from Costa Rica (13.5%, a difference of 0.0%), Kenyan (13.5%, a difference of 0.010%), Immigrants from Uganda (13.5%, a difference of 0.090%), Immigrants from Oceania (13.5%, a difference of 0.16%), and Samoan (13.5%, a difference of 0.41%).
| Demographics | Rating | Rank | Female Poverty Among 25-34 Year Olds |
| Swiss | 61.7 /100 | #164 | Good 13.4% |
| Basques | 59.3 /100 | #165 | Average 13.4% |
| Belgians | 58.9 /100 | #166 | Average 13.4% |
| Immigrants | Bosnia and Herzegovina | 58.6 /100 | #167 | Average 13.4% |
| Immigrants | Afghanistan | 57.7 /100 | #168 | Average 13.4% |
| Samoans | 56.8 /100 | #169 | Average 13.5% |
| Immigrants | Uganda | 53.0 /100 | #170 | Average 13.5% |
| South American Indians | 51.9 /100 | #171 | Average 13.5% |
| Immigrants | Costa Rica | 51.9 /100 | #172 | Average 13.5% |
| Kenyans | 51.8 /100 | #173 | Average 13.5% |
| Immigrants | Oceania | 50.0 /100 | #174 | Average 13.5% |
| Bermudans | 46.8 /100 | #175 | Average 13.6% |
| Yugoslavians | 45.0 /100 | #176 | Average 13.6% |
| Venezuelans | 44.6 /100 | #177 | Average 13.6% |
| Canadians | 44.3 /100 | #178 | Average 13.6% |
Demographics Similar to Iraqis by Female Poverty Among 25-34 Year Olds
In terms of female poverty among 25-34 year olds, the demographic groups most similar to Iraqis are Sierra Leonean (13.2%, a difference of 0.030%), Costa Rican (13.2%, a difference of 0.030%), Slavic (13.2%, a difference of 0.040%), European (13.2%, a difference of 0.090%), and Lebanese (13.2%, a difference of 0.090%).
| Demographics | Rating | Rank | Female Poverty Among 25-34 Year Olds |
| Israelis | 81.9 /100 | #143 | Excellent 13.1% |
| Native Hawaiians | 78.9 /100 | #144 | Good 13.2% |
| Colombians | 77.2 /100 | #145 | Good 13.2% |
| South Americans | 76.9 /100 | #146 | Good 13.2% |
| Europeans | 76.8 /100 | #147 | Good 13.2% |
| Lebanese | 76.8 /100 | #148 | Good 13.2% |
| Sierra Leoneans | 76.3 /100 | #149 | Good 13.2% |
| Iraqis | 76.0 /100 | #150 | Good 13.2% |
| Costa Ricans | 75.8 /100 | #151 | Good 13.2% |
| Slavs | 75.7 /100 | #152 | Good 13.2% |
| Northern Europeans | 73.7 /100 | #153 | Good 13.2% |
| Arabs | 73.5 /100 | #154 | Good 13.2% |
| Immigrants | Sierra Leone | 72.9 /100 | #155 | Good 13.3% |
| Immigrants | Cameroon | 72.0 /100 | #156 | Good 13.3% |
| Immigrants | Western Europe | 70.3 /100 | #157 | Good 13.3% |