German vs Iraqi Householder Income Ages 45 - 64 years
COMPARE
German
Iraqi
Householder Income Ages 45 - 64 years
Householder Income Ages 45 - 64 years Comparison
Germans
Iraqis
$100,224
HOUSEHOLDER INCOME AGES 45 - 64 YEARS
48.8/ 100
METRIC RATING
175th/ 347
METRIC RANK
$99,387
HOUSEHOLDER INCOME AGES 45 - 64 YEARS
38.5/ 100
METRIC RATING
187th/ 347
METRIC RANK
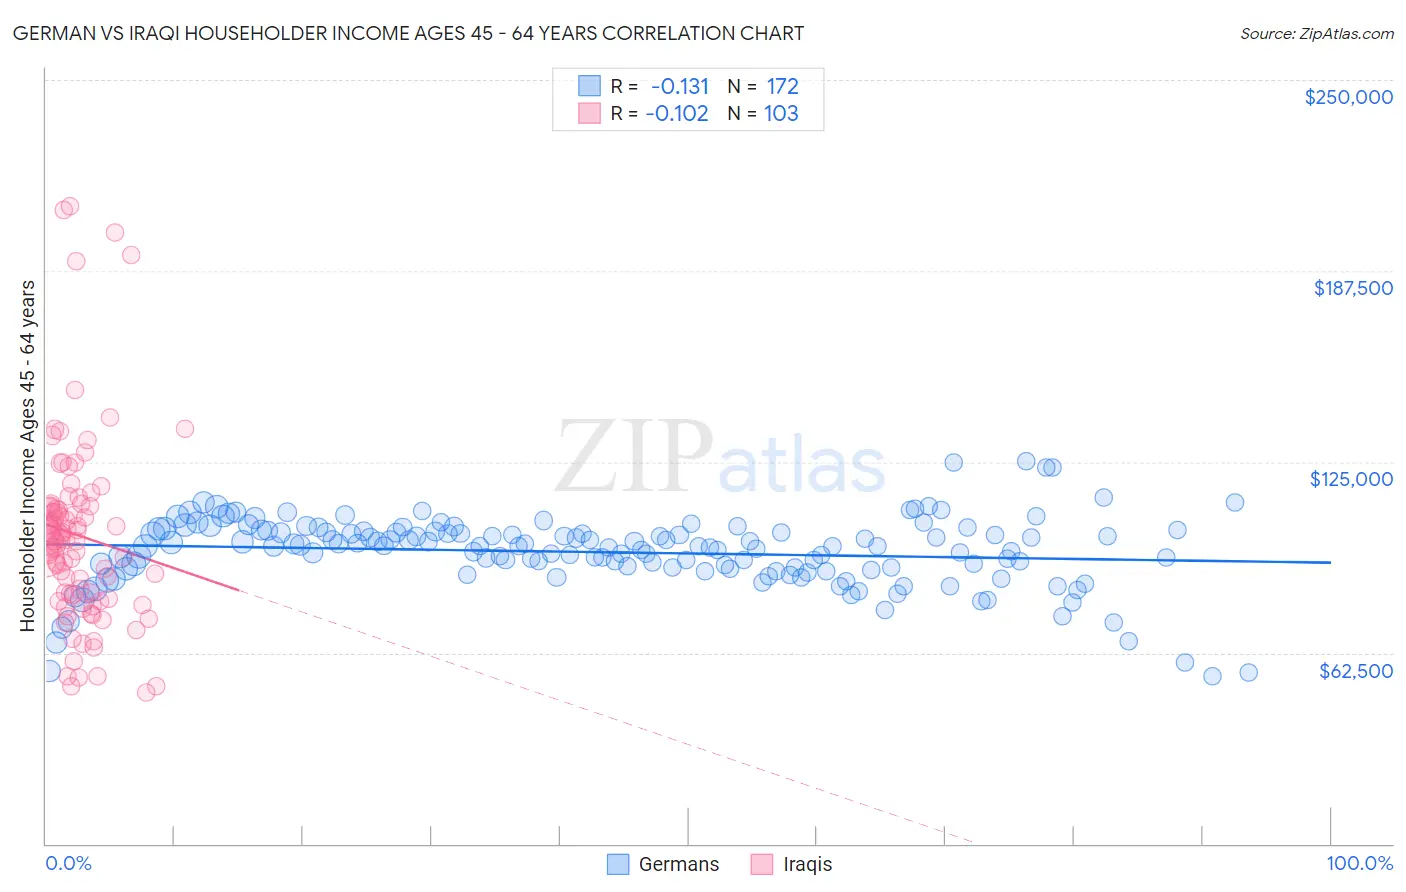
German vs Iraqi Householder Income Ages 45 - 64 years Correlation Chart
The statistical analysis conducted on geographies consisting of 575,941,982 people shows a poor negative correlation between the proportion of Germans and household income with householder between the ages 45 and 64 in the United States with a correlation coefficient (R) of -0.131 and weighted average of $100,224. Similarly, the statistical analysis conducted on geographies consisting of 170,546,926 people shows a poor negative correlation between the proportion of Iraqis and household income with householder between the ages 45 and 64 in the United States with a correlation coefficient (R) of -0.102 and weighted average of $99,387, a difference of 0.84%.
Householder Income Ages 45 - 64 years Correlation Summary
| Measurement | German | Iraqi |
| Minimum | $54,688 | $49,554 |
| Maximum | $125,293 | $208,614 |
| Range | $70,605 | $159,060 |
| Mean | $95,438 | $101,029 |
| Median | $97,438 | $99,398 |
| Interquartile 25% (IQ1) | $90,029 | $81,325 |
| Interquartile 75% (IQ3) | $102,031 | $110,313 |
| Interquartile Range (IQR) | $12,003 | $28,988 |
| Standard Deviation (Sample) | $11,697 | $30,760 |
| Standard Deviation (Population) | $11,663 | $30,611 |
Demographics Similar to Germans and Iraqis by Householder Income Ages 45 - 64 years
In terms of householder income ages 45 - 64 years, the demographic groups most similar to Germans are Immigrants from Costa Rica ($100,141, a difference of 0.080%), Moroccan ($100,138, a difference of 0.090%), Welsh ($100,322, a difference of 0.10%), Immigrants from Cameroon ($100,084, a difference of 0.14%), and Belgian ($100,060, a difference of 0.16%). Similarly, the demographic groups most similar to Iraqis are Immigrants from Portugal ($99,203, a difference of 0.19%), Immigrants from South America ($99,126, a difference of 0.26%), Dutch ($99,650, a difference of 0.27%), French Canadian ($99,093, a difference of 0.30%), and Colombian ($99,772, a difference of 0.39%).
| Demographics | Rating | Rank | Householder Income Ages 45 - 64 years |
| South Americans | 56.4 /100 | #171 | Average $100,837 |
| Immigrants | Uzbekistan | 52.5 /100 | #172 | Average $100,523 |
| Alsatians | 51.4 /100 | #173 | Average $100,435 |
| Welsh | 50.0 /100 | #174 | Average $100,322 |
| Germans | 48.8 /100 | #175 | Average $100,224 |
| Immigrants | Costa Rica | 47.7 /100 | #176 | Average $100,141 |
| Moroccans | 47.7 /100 | #177 | Average $100,138 |
| Immigrants | Cameroon | 47.0 /100 | #178 | Average $100,084 |
| Belgians | 46.7 /100 | #179 | Average $100,060 |
| Aleuts | 46.6 /100 | #180 | Average $100,052 |
| Immigrants | Immigrants | 45.3 /100 | #181 | Average $99,943 |
| Finns | 44.8 /100 | #182 | Average $99,904 |
| Spaniards | 44.6 /100 | #183 | Average $99,889 |
| French | 43.8 /100 | #184 | Average $99,824 |
| Colombians | 43.2 /100 | #185 | Average $99,772 |
| Dutch | 41.7 /100 | #186 | Average $99,650 |
| Iraqis | 38.5 /100 | #187 | Fair $99,387 |
| Immigrants | Portugal | 36.3 /100 | #188 | Fair $99,203 |
| Immigrants | South America | 35.4 /100 | #189 | Fair $99,126 |
| French Canadians | 35.1 /100 | #190 | Fair $99,093 |
| Kenyans | 33.7 /100 | #191 | Fair $98,970 |