Cree vs Chilean Householder Income Ages 25 - 44 years
COMPARE
Cree
Chilean
Householder Income Ages 25 - 44 years
Householder Income Ages 25 - 44 years Comparison
Cree
Chileans
$84,574
HOUSEHOLDER INCOME AGES 25 - 44 YEARS
0.4/ 100
METRIC RATING
262nd/ 347
METRIC RANK
$99,900
HOUSEHOLDER INCOME AGES 25 - 44 YEARS
95.1/ 100
METRIC RATING
111th/ 347
METRIC RANK
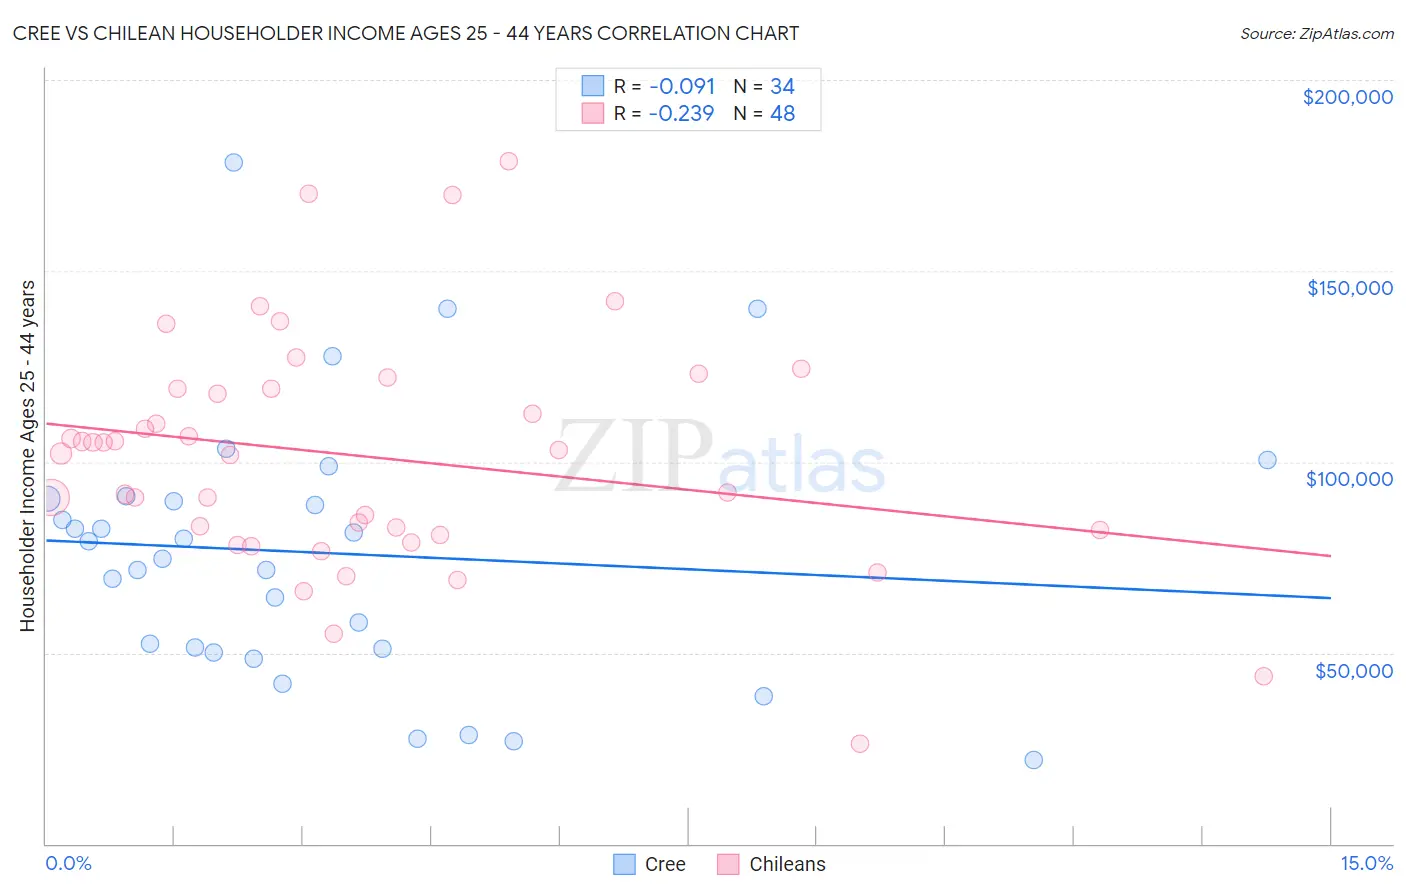
Cree vs Chilean Householder Income Ages 25 - 44 years Correlation Chart
The statistical analysis conducted on geographies consisting of 76,153,555 people shows a slight negative correlation between the proportion of Cree and household income with householder between the ages 25 and 44 in the United States with a correlation coefficient (R) of -0.091 and weighted average of $84,574. Similarly, the statistical analysis conducted on geographies consisting of 256,390,740 people shows a weak negative correlation between the proportion of Chileans and household income with householder between the ages 25 and 44 in the United States with a correlation coefficient (R) of -0.239 and weighted average of $99,900, a difference of 18.1%.
Householder Income Ages 25 - 44 years Correlation Summary
| Measurement | Cree | Chilean |
| Minimum | $22,083 | $26,028 |
| Maximum | $178,304 | $178,828 |
| Range | $156,221 | $152,800 |
| Mean | $76,111 | $101,398 |
| Median | $76,790 | $102,616 |
| Interquartile 25% (IQ1) | $50,987 | $81,519 |
| Interquartile 75% (IQ3) | $90,298 | $119,228 |
| Interquartile Range (IQR) | $39,311 | $37,709 |
| Standard Deviation (Sample) | $35,026 | $30,801 |
| Standard Deviation (Population) | $34,507 | $30,478 |
Similar Demographics by Householder Income Ages 25 - 44 years
Demographics Similar to Cree by Householder Income Ages 25 - 44 years
In terms of householder income ages 25 - 44 years, the demographic groups most similar to Cree are Inupiat ($84,619, a difference of 0.050%), Belizean ($84,534, a difference of 0.050%), Osage ($84,461, a difference of 0.13%), Sudanese ($84,401, a difference of 0.20%), and American ($84,791, a difference of 0.26%).
| Demographics | Rating | Rank | Householder Income Ages 25 - 44 years |
| German Russians | 0.6 /100 | #255 | Tragic $85,220 |
| Central Americans | 0.5 /100 | #256 | Tragic $85,144 |
| Mexican American Indians | 0.5 /100 | #257 | Tragic $85,066 |
| Immigrants | Nicaragua | 0.5 /100 | #258 | Tragic $84,914 |
| Immigrants | Senegal | 0.5 /100 | #259 | Tragic $84,848 |
| Americans | 0.4 /100 | #260 | Tragic $84,791 |
| Inupiat | 0.4 /100 | #261 | Tragic $84,619 |
| Cree | 0.4 /100 | #262 | Tragic $84,574 |
| Belizeans | 0.4 /100 | #263 | Tragic $84,534 |
| Osage | 0.4 /100 | #264 | Tragic $84,461 |
| Sudanese | 0.4 /100 | #265 | Tragic $84,401 |
| Immigrants | Cabo Verde | 0.3 /100 | #266 | Tragic $84,304 |
| Hmong | 0.3 /100 | #267 | Tragic $84,258 |
| Sub-Saharan Africans | 0.3 /100 | #268 | Tragic $84,235 |
| Spanish American Indians | 0.3 /100 | #269 | Tragic $84,085 |
Demographics Similar to Chileans by Householder Income Ages 25 - 44 years
In terms of householder income ages 25 - 44 years, the demographic groups most similar to Chileans are Immigrants from Afghanistan ($99,977, a difference of 0.080%), Immigrants from North Macedonia ($100,101, a difference of 0.20%), Polish ($99,685, a difference of 0.22%), Tongan ($99,604, a difference of 0.30%), and Immigrants from South Eastern Asia ($100,283, a difference of 0.38%).
| Demographics | Rating | Rank | Householder Income Ages 25 - 44 years |
| Immigrants | Poland | 97.4 /100 | #104 | Exceptional $101,065 |
| Immigrants | Vietnam | 96.5 /100 | #105 | Exceptional $100,535 |
| Immigrants | Brazil | 96.5 /100 | #106 | Exceptional $100,534 |
| Northern Europeans | 96.3 /100 | #107 | Exceptional $100,457 |
| Immigrants | South Eastern Asia | 96.0 /100 | #108 | Exceptional $100,283 |
| Immigrants | North Macedonia | 95.6 /100 | #109 | Exceptional $100,101 |
| Immigrants | Afghanistan | 95.3 /100 | #110 | Exceptional $99,977 |
| Chileans | 95.1 /100 | #111 | Exceptional $99,900 |
| Poles | 94.5 /100 | #112 | Exceptional $99,685 |
| Tongans | 94.2 /100 | #113 | Exceptional $99,604 |
| Immigrants | Western Asia | 94.0 /100 | #114 | Exceptional $99,516 |
| Carpatho Rusyns | 93.7 /100 | #115 | Exceptional $99,449 |
| Portuguese | 93.7 /100 | #116 | Exceptional $99,429 |
| Immigrants | Northern Africa | 93.0 /100 | #117 | Exceptional $99,232 |
| Syrians | 92.9 /100 | #118 | Exceptional $99,215 |