South African vs Immigrants from Western Asia Householder Income Ages 25 - 44 years
COMPARE
South African
Immigrants from Western Asia
Householder Income Ages 25 - 44 years
Householder Income Ages 25 - 44 years Comparison
South Africans
Immigrants from Western Asia
$103,160
HOUSEHOLDER INCOME AGES 25 - 44 YEARS
99.2/ 100
METRIC RATING
81st/ 347
METRIC RANK
$99,516
HOUSEHOLDER INCOME AGES 25 - 44 YEARS
94.0/ 100
METRIC RATING
114th/ 347
METRIC RANK
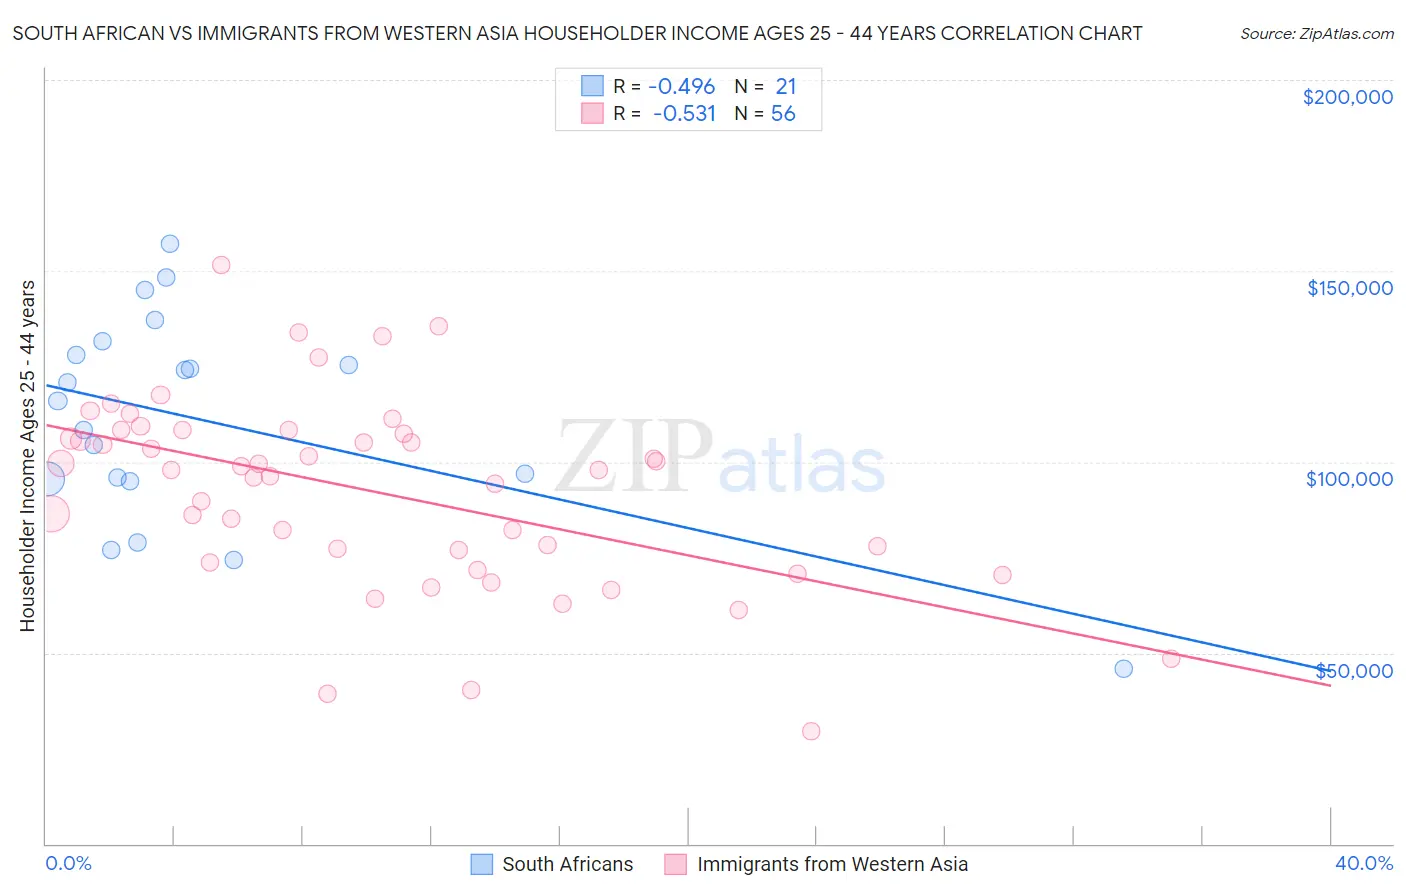
South African vs Immigrants from Western Asia Householder Income Ages 25 - 44 years Correlation Chart
The statistical analysis conducted on geographies consisting of 182,377,934 people shows a moderate negative correlation between the proportion of South Africans and household income with householder between the ages 25 and 44 in the United States with a correlation coefficient (R) of -0.496 and weighted average of $103,160. Similarly, the statistical analysis conducted on geographies consisting of 403,414,437 people shows a substantial negative correlation between the proportion of Immigrants from Western Asia and household income with householder between the ages 25 and 44 in the United States with a correlation coefficient (R) of -0.531 and weighted average of $99,516, a difference of 3.7%.
Householder Income Ages 25 - 44 years Correlation Summary
| Measurement | South African | Immigrants from Western Asia |
| Minimum | $45,714 | $29,492 |
| Maximum | $156,974 | $151,438 |
| Range | $111,260 | $121,946 |
| Mean | $110,921 | $92,165 |
| Median | $115,903 | $97,998 |
| Interquartile 25% (IQ1) | $95,265 | $75,153 |
| Interquartile 75% (IQ3) | $129,677 | $107,722 |
| Interquartile Range (IQR) | $34,411 | $32,569 |
| Standard Deviation (Sample) | $27,826 | $24,816 |
| Standard Deviation (Population) | $27,156 | $24,593 |
Similar Demographics by Householder Income Ages 25 - 44 years
Demographics Similar to South Africans by Householder Income Ages 25 - 44 years
In terms of householder income ages 25 - 44 years, the demographic groups most similar to South Africans are Immigrants from Serbia ($103,155, a difference of 0.010%), Immigrants from Egypt ($103,192, a difference of 0.030%), Argentinean ($103,111, a difference of 0.050%), Armenian ($103,248, a difference of 0.080%), and Immigrants from Philippines ($102,910, a difference of 0.24%).
| Demographics | Rating | Rank | Householder Income Ages 25 - 44 years |
| Immigrants | Fiji | 99.5 /100 | #74 | Exceptional $103,954 |
| Koreans | 99.4 /100 | #75 | Exceptional $103,824 |
| Immigrants | Spain | 99.4 /100 | #76 | Exceptional $103,752 |
| Immigrants | Southern Europe | 99.3 /100 | #77 | Exceptional $103,486 |
| Immigrants | Bulgaria | 99.3 /100 | #78 | Exceptional $103,423 |
| Armenians | 99.2 /100 | #79 | Exceptional $103,248 |
| Immigrants | Egypt | 99.2 /100 | #80 | Exceptional $103,192 |
| South Africans | 99.2 /100 | #81 | Exceptional $103,160 |
| Immigrants | Serbia | 99.2 /100 | #82 | Exceptional $103,155 |
| Argentineans | 99.1 /100 | #83 | Exceptional $103,111 |
| Immigrants | Philippines | 99.0 /100 | #84 | Exceptional $102,910 |
| Immigrants | Ukraine | 98.9 /100 | #85 | Exceptional $102,664 |
| Immigrants | Hungary | 98.9 /100 | #86 | Exceptional $102,655 |
| Immigrants | Western Europe | 98.9 /100 | #87 | Exceptional $102,654 |
| Immigrants | Canada | 98.9 /100 | #88 | Exceptional $102,616 |
Demographics Similar to Immigrants from Western Asia by Householder Income Ages 25 - 44 years
In terms of householder income ages 25 - 44 years, the demographic groups most similar to Immigrants from Western Asia are Carpatho Rusyn ($99,449, a difference of 0.070%), Tongan ($99,604, a difference of 0.090%), Portuguese ($99,429, a difference of 0.090%), Polish ($99,685, a difference of 0.17%), and Immigrants from Northern Africa ($99,232, a difference of 0.29%).
| Demographics | Rating | Rank | Householder Income Ages 25 - 44 years |
| Northern Europeans | 96.3 /100 | #107 | Exceptional $100,457 |
| Immigrants | South Eastern Asia | 96.0 /100 | #108 | Exceptional $100,283 |
| Immigrants | North Macedonia | 95.6 /100 | #109 | Exceptional $100,101 |
| Immigrants | Afghanistan | 95.3 /100 | #110 | Exceptional $99,977 |
| Chileans | 95.1 /100 | #111 | Exceptional $99,900 |
| Poles | 94.5 /100 | #112 | Exceptional $99,685 |
| Tongans | 94.2 /100 | #113 | Exceptional $99,604 |
| Immigrants | Western Asia | 94.0 /100 | #114 | Exceptional $99,516 |
| Carpatho Rusyns | 93.7 /100 | #115 | Exceptional $99,449 |
| Portuguese | 93.7 /100 | #116 | Exceptional $99,429 |
| Immigrants | Northern Africa | 93.0 /100 | #117 | Exceptional $99,232 |
| Syrians | 92.9 /100 | #118 | Exceptional $99,215 |
| Jordanians | 92.8 /100 | #119 | Exceptional $99,186 |
| Swedes | 92.7 /100 | #120 | Exceptional $99,136 |
| Peruvians | 91.7 /100 | #121 | Exceptional $98,886 |