South African vs Immigrants from Middle Africa Householder Income Ages 45 - 64 years
COMPARE
South African
Immigrants from Middle Africa
Householder Income Ages 45 - 64 years
Householder Income Ages 45 - 64 years Comparison
South Africans
Immigrants from Middle Africa
$109,719
HOUSEHOLDER INCOME AGES 45 - 64 YEARS
99.1/ 100
METRIC RATING
75th/ 347
METRIC RANK
$91,293
HOUSEHOLDER INCOME AGES 45 - 64 YEARS
1.1/ 100
METRIC RATING
244th/ 347
METRIC RANK
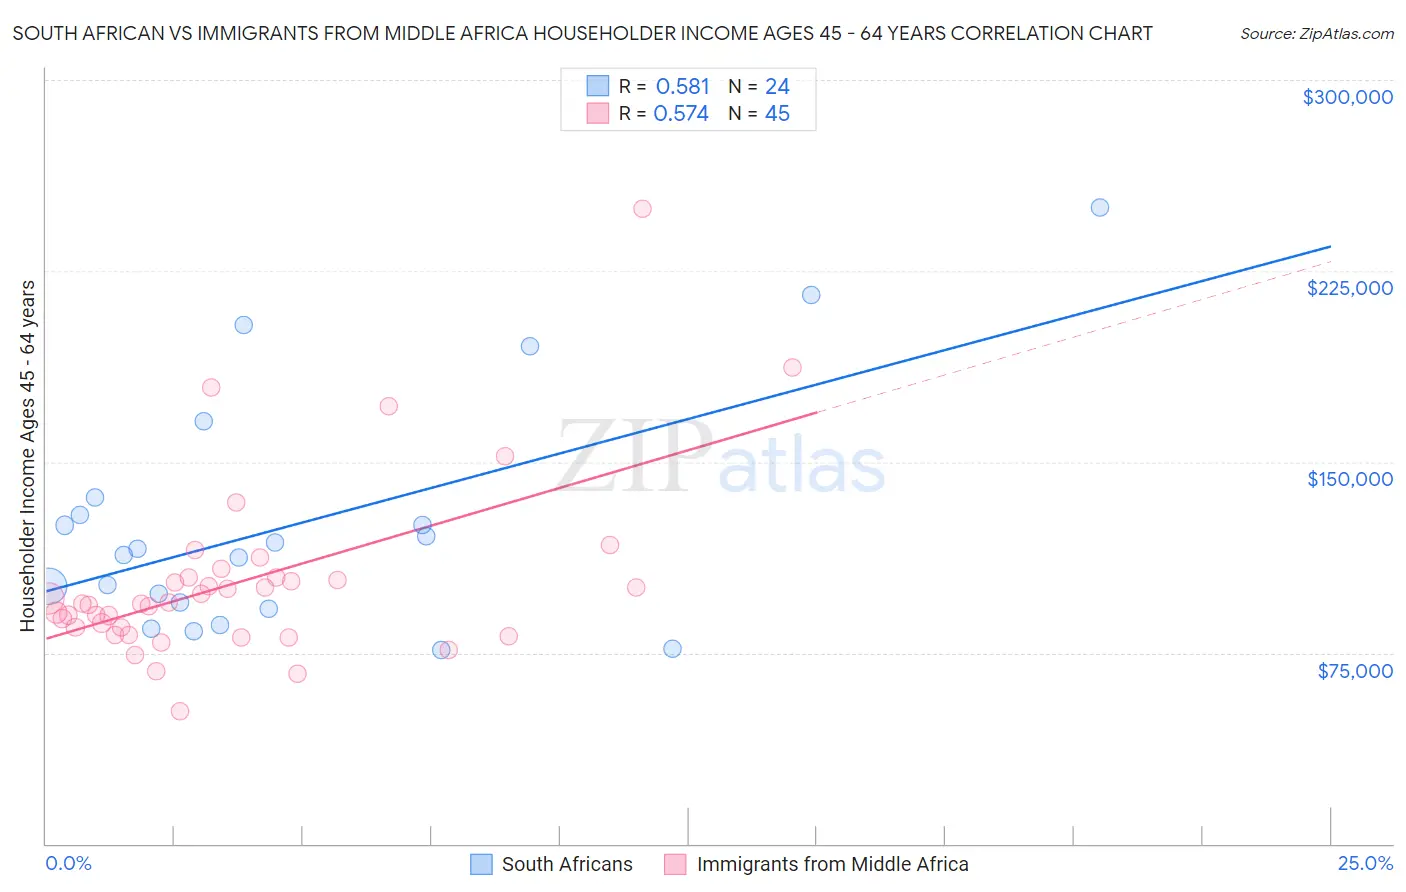
South African vs Immigrants from Middle Africa Householder Income Ages 45 - 64 years Correlation Chart
The statistical analysis conducted on geographies consisting of 182,453,262 people shows a substantial positive correlation between the proportion of South Africans and household income with householder between the ages 45 and 64 in the United States with a correlation coefficient (R) of 0.581 and weighted average of $109,719. Similarly, the statistical analysis conducted on geographies consisting of 202,576,362 people shows a substantial positive correlation between the proportion of Immigrants from Middle Africa and household income with householder between the ages 45 and 64 in the United States with a correlation coefficient (R) of 0.574 and weighted average of $91,293, a difference of 20.2%.
Householder Income Ages 45 - 64 years Correlation Summary
| Measurement | South African | Immigrants from Middle Africa |
| Minimum | $76,250 | $51,937 |
| Maximum | $250,001 | $249,250 |
| Range | $173,751 | $197,313 |
| Mean | $125,894 | $103,154 |
| Median | $114,605 | $94,432 |
| Interquartile 25% (IQ1) | $93,424 | $83,489 |
| Interquartile 75% (IQ3) | $132,734 | $104,529 |
| Interquartile Range (IQR) | $39,311 | $21,040 |
| Standard Deviation (Sample) | $46,946 | $35,287 |
| Standard Deviation (Population) | $45,958 | $34,892 |
Similar Demographics by Householder Income Ages 45 - 64 years
Demographics Similar to South Africans by Householder Income Ages 45 - 64 years
In terms of householder income ages 45 - 64 years, the demographic groups most similar to South Africans are Immigrants from Egypt ($109,941, a difference of 0.20%), Paraguayan ($109,447, a difference of 0.25%), Immigrants from England ($109,446, a difference of 0.25%), Immigrants from Canada ($109,402, a difference of 0.29%), and Immigrants from Bulgaria ($109,379, a difference of 0.31%).
| Demographics | Rating | Rank | Householder Income Ages 45 - 64 years |
| Immigrants | Romania | 99.4 /100 | #68 | Exceptional $110,633 |
| Immigrants | Italy | 99.4 /100 | #69 | Exceptional $110,434 |
| Koreans | 99.3 /100 | #70 | Exceptional $110,334 |
| Italians | 99.3 /100 | #71 | Exceptional $110,224 |
| Assyrians/Chaldeans/Syriacs | 99.3 /100 | #72 | Exceptional $110,201 |
| Argentineans | 99.3 /100 | #73 | Exceptional $110,103 |
| Immigrants | Egypt | 99.2 /100 | #74 | Exceptional $109,941 |
| South Africans | 99.1 /100 | #75 | Exceptional $109,719 |
| Paraguayans | 99.0 /100 | #76 | Exceptional $109,447 |
| Immigrants | England | 99.0 /100 | #77 | Exceptional $109,446 |
| Immigrants | Canada | 99.0 /100 | #78 | Exceptional $109,402 |
| Immigrants | Bulgaria | 98.9 /100 | #79 | Exceptional $109,379 |
| Jordanians | 98.9 /100 | #80 | Exceptional $109,376 |
| Immigrants | Eastern Europe | 98.9 /100 | #81 | Exceptional $109,335 |
| Immigrants | North America | 98.8 /100 | #82 | Exceptional $109,198 |
Demographics Similar to Immigrants from Middle Africa by Householder Income Ages 45 - 64 years
In terms of householder income ages 45 - 64 years, the demographic groups most similar to Immigrants from Middle Africa are Immigrants from Trinidad and Tobago ($91,347, a difference of 0.060%), Trinidadian and Tobagonian ($91,357, a difference of 0.070%), Inupiat ($91,355, a difference of 0.070%), Immigrants from Burma/Myanmar ($91,385, a difference of 0.10%), and Immigrants from Ecuador ($91,462, a difference of 0.19%).
| Demographics | Rating | Rank | Householder Income Ages 45 - 64 years |
| Immigrants | Bangladesh | 1.7 /100 | #237 | Tragic $92,208 |
| Pennsylvania Germans | 1.5 /100 | #238 | Tragic $91,956 |
| Immigrants | Ecuador | 1.2 /100 | #239 | Tragic $91,462 |
| Immigrants | Burma/Myanmar | 1.1 /100 | #240 | Tragic $91,385 |
| Trinidadians and Tobagonians | 1.1 /100 | #241 | Tragic $91,357 |
| Inupiat | 1.1 /100 | #242 | Tragic $91,355 |
| Immigrants | Trinidad and Tobago | 1.1 /100 | #243 | Tragic $91,347 |
| Immigrants | Middle Africa | 1.1 /100 | #244 | Tragic $91,293 |
| Guyanese | 0.9 /100 | #245 | Tragic $90,966 |
| Central Americans | 0.9 /100 | #246 | Tragic $90,951 |
| Alaskan Athabascans | 0.9 /100 | #247 | Tragic $90,951 |
| Immigrants | Laos | 0.9 /100 | #248 | Tragic $90,909 |
| Mexican American Indians | 0.8 /100 | #249 | Tragic $90,811 |
| Sub-Saharan Africans | 0.8 /100 | #250 | Tragic $90,691 |
| Americans | 0.7 /100 | #251 | Tragic $90,536 |