Somali vs Immigrants from Korea Median Female Earnings
COMPARE
Somali
Immigrants from Korea
Median Female Earnings
Median Female Earnings Comparison
Somalis
Immigrants from Korea
$38,333
MEDIAN FEMALE EARNINGS
5.5/ 100
METRIC RATING
231st/ 347
METRIC RANK
$44,847
MEDIAN FEMALE EARNINGS
100.0/ 100
METRIC RATING
24th/ 347
METRIC RANK
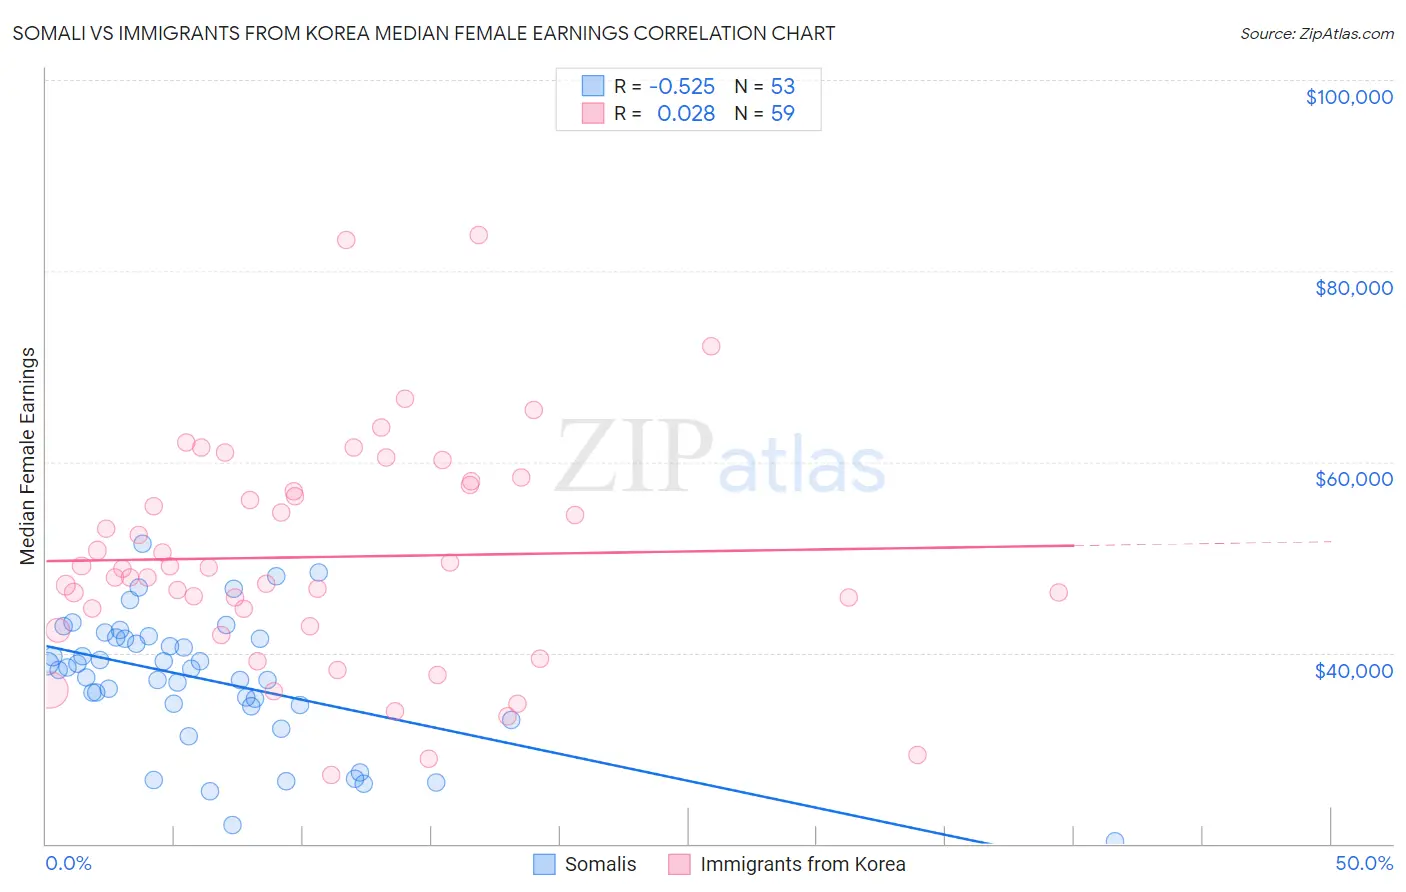
Somali vs Immigrants from Korea Median Female Earnings Correlation Chart
The statistical analysis conducted on geographies consisting of 99,326,973 people shows a substantial negative correlation between the proportion of Somalis and median female earnings in the United States with a correlation coefficient (R) of -0.525 and weighted average of $38,333. Similarly, the statistical analysis conducted on geographies consisting of 416,108,696 people shows no correlation between the proportion of Immigrants from Korea and median female earnings in the United States with a correlation coefficient (R) of 0.028 and weighted average of $44,847, a difference of 17.0%.
Median Female Earnings Correlation Summary
| Measurement | Somali | Immigrants from Korea |
| Minimum | $20,281 | $27,183 |
| Maximum | $51,368 | $83,750 |
| Range | $31,087 | $56,567 |
| Mean | $37,176 | $50,048 |
| Median | $38,333 | $48,754 |
| Interquartile 25% (IQ1) | $34,463 | $42,787 |
| Interquartile 75% (IQ3) | $41,523 | $57,558 |
| Interquartile Range (IQR) | $7,060 | $14,771 |
| Standard Deviation (Sample) | $6,829 | $11,764 |
| Standard Deviation (Population) | $6,765 | $11,664 |
Similar Demographics by Median Female Earnings
Demographics Similar to Somalis by Median Female Earnings
In terms of median female earnings, the demographic groups most similar to Somalis are Basque ($38,352, a difference of 0.050%), Scandinavian ($38,306, a difference of 0.070%), Tongan ($38,288, a difference of 0.12%), Belgian ($38,382, a difference of 0.13%), and Celtic ($38,283, a difference of 0.13%).
| Demographics | Rating | Rank | Median Female Earnings |
| Native Hawaiians | 7.1 /100 | #224 | Tragic $38,461 |
| French | 7.0 /100 | #225 | Tragic $38,457 |
| French Canadians | 6.8 /100 | #226 | Tragic $38,436 |
| Scottish | 6.3 /100 | #227 | Tragic $38,397 |
| Sub-Saharan Africans | 6.2 /100 | #228 | Tragic $38,391 |
| Belgians | 6.1 /100 | #229 | Tragic $38,382 |
| Basques | 5.7 /100 | #230 | Tragic $38,352 |
| Somalis | 5.5 /100 | #231 | Tragic $38,333 |
| Scandinavians | 5.2 /100 | #232 | Tragic $38,306 |
| Tongans | 5.1 /100 | #233 | Tragic $38,288 |
| Celtics | 5.0 /100 | #234 | Tragic $38,283 |
| Sudanese | 4.4 /100 | #235 | Tragic $38,215 |
| Liberians | 4.4 /100 | #236 | Tragic $38,215 |
| Immigrants | Cabo Verde | 4.3 /100 | #237 | Tragic $38,208 |
| Alaska Natives | 4.3 /100 | #238 | Tragic $38,202 |
Demographics Similar to Immigrants from Korea by Median Female Earnings
In terms of median female earnings, the demographic groups most similar to Immigrants from Korea are Burmese ($44,911, a difference of 0.14%), Immigrants from Sweden ($44,774, a difference of 0.16%), Immigrants from Belarus ($44,757, a difference of 0.20%), Immigrants from Greece ($44,976, a difference of 0.29%), and Turkish ($44,695, a difference of 0.34%).
| Demographics | Rating | Rank | Median Female Earnings |
| Immigrants | South Central Asia | 100.0 /100 | #17 | Exceptional $46,324 |
| Cypriots | 100.0 /100 | #18 | Exceptional $45,570 |
| Eastern Europeans | 100.0 /100 | #19 | Exceptional $45,385 |
| Immigrants | Japan | 100.0 /100 | #20 | Exceptional $45,323 |
| Cambodians | 100.0 /100 | #21 | Exceptional $45,014 |
| Immigrants | Greece | 100.0 /100 | #22 | Exceptional $44,976 |
| Burmese | 100.0 /100 | #23 | Exceptional $44,911 |
| Immigrants | Korea | 100.0 /100 | #24 | Exceptional $44,847 |
| Immigrants | Sweden | 100.0 /100 | #25 | Exceptional $44,774 |
| Immigrants | Belarus | 100.0 /100 | #26 | Exceptional $44,757 |
| Turks | 100.0 /100 | #27 | Exceptional $44,695 |
| Immigrants | Russia | 100.0 /100 | #28 | Exceptional $44,680 |
| Immigrants | Belgium | 100.0 /100 | #29 | Exceptional $44,587 |
| Asians | 100.0 /100 | #30 | Exceptional $44,586 |
| Immigrants | France | 100.0 /100 | #31 | Exceptional $44,541 |