Somali vs Immigrants from Korea Unemployment Among Women with Children Under 18 years
COMPARE
Somali
Immigrants from Korea
Unemployment Among Women with Children Under 18 years
Unemployment Among Women with Children Under 18 years Comparison
Somalis
Immigrants from Korea
5.8%
UNEMPLOYMENT AMONG WOMEN WITH CHILDREN UNDER 18 YEARS
3.5/ 100
METRIC RATING
228th/ 347
METRIC RANK
5.0%
UNEMPLOYMENT AMONG WOMEN WITH CHILDREN UNDER 18 YEARS
98.7/ 100
METRIC RATING
46th/ 347
METRIC RANK
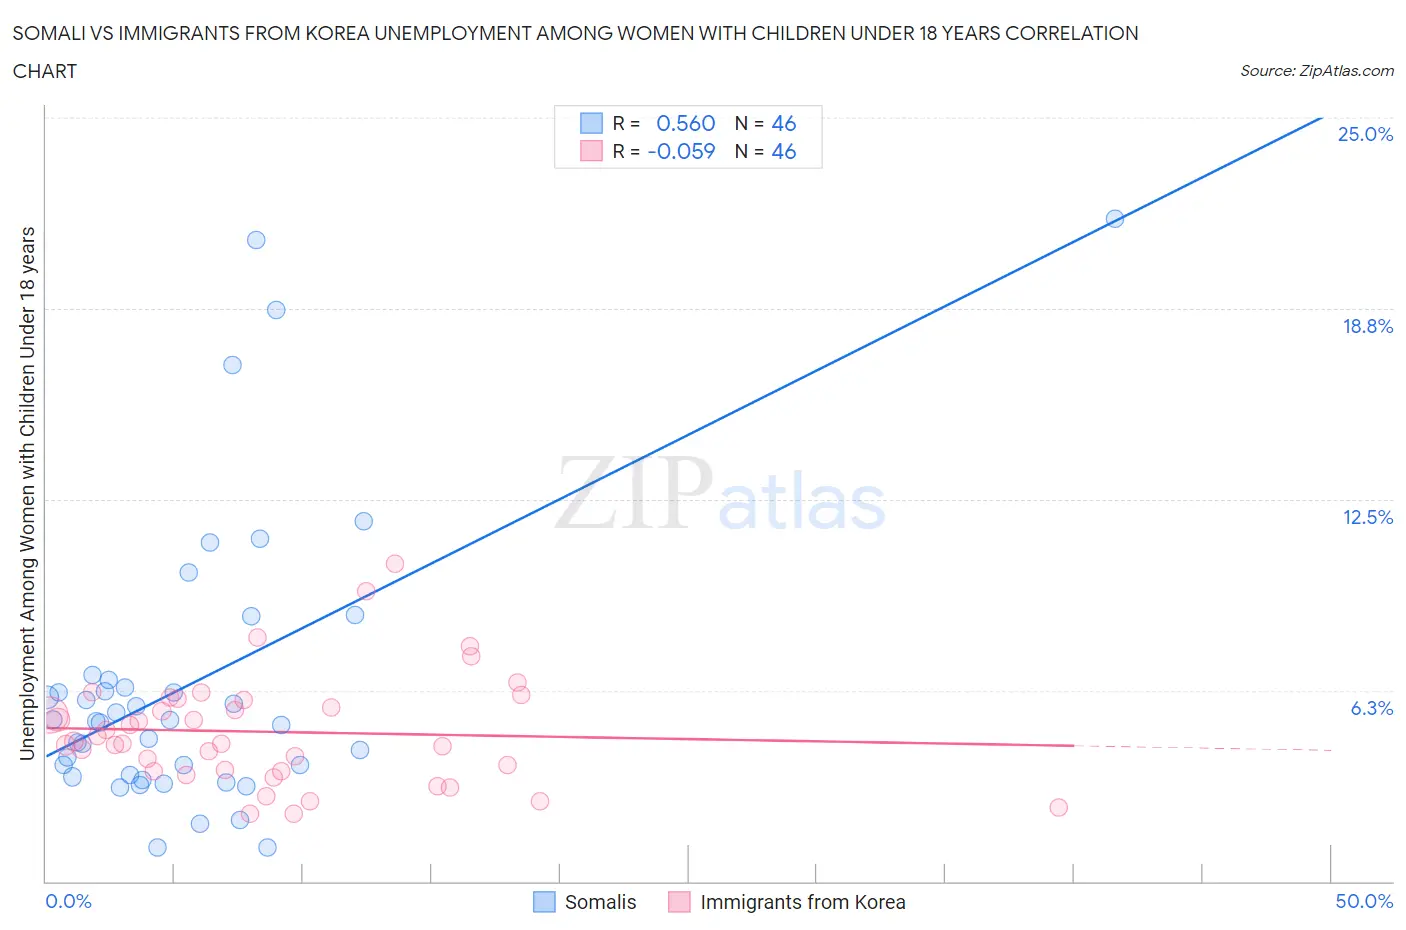
Somali vs Immigrants from Korea Unemployment Among Women with Children Under 18 years Correlation Chart
The statistical analysis conducted on geographies consisting of 97,989,792 people shows a substantial positive correlation between the proportion of Somalis and unemployment rate among women with children under the age of 18 in the United States with a correlation coefficient (R) of 0.560 and weighted average of 5.8%. Similarly, the statistical analysis conducted on geographies consisting of 398,833,856 people shows a slight negative correlation between the proportion of Immigrants from Korea and unemployment rate among women with children under the age of 18 in the United States with a correlation coefficient (R) of -0.059 and weighted average of 5.0%, a difference of 14.7%.
Unemployment Among Women with Children Under 18 years Correlation Summary
| Measurement | Somali | Immigrants from Korea |
| Minimum | 1.1% | 2.2% |
| Maximum | 21.7% | 10.4% |
| Range | 20.6% | 8.2% |
| Mean | 6.5% | 4.9% |
| Median | 5.3% | 4.5% |
| Interquartile 25% (IQ1) | 3.5% | 3.6% |
| Interquartile 75% (IQ3) | 6.6% | 5.9% |
| Interquartile Range (IQR) | 3.1% | 2.3% |
| Standard Deviation (Sample) | 4.8% | 1.8% |
| Standard Deviation (Population) | 4.7% | 1.8% |
Similar Demographics by Unemployment Among Women with Children Under 18 years
Demographics Similar to Somalis by Unemployment Among Women with Children Under 18 years
In terms of unemployment among women with children under 18 years, the demographic groups most similar to Somalis are Immigrants from Panama (5.8%, a difference of 0.090%), Sierra Leonean (5.8%, a difference of 0.14%), Immigrants from South America (5.8%, a difference of 0.15%), Immigrants from Africa (5.8%, a difference of 0.21%), and Creek (5.8%, a difference of 0.24%).
| Demographics | Rating | Rank | Unemployment Among Women with Children Under 18 years |
| Pennsylvania Germans | 5.7 /100 | #221 | Tragic 5.7% |
| Osage | 5.0 /100 | #222 | Tragic 5.7% |
| Potawatomi | 5.0 /100 | #223 | Tragic 5.7% |
| Immigrants | Syria | 4.6 /100 | #224 | Tragic 5.7% |
| Armenians | 4.5 /100 | #225 | Tragic 5.7% |
| Cherokee | 4.3 /100 | #226 | Tragic 5.7% |
| Sierra Leoneans | 3.8 /100 | #227 | Tragic 5.8% |
| Somalis | 3.5 /100 | #228 | Tragic 5.8% |
| Immigrants | Panama | 3.4 /100 | #229 | Tragic 5.8% |
| Immigrants | South America | 3.2 /100 | #230 | Tragic 5.8% |
| Immigrants | Africa | 3.1 /100 | #231 | Tragic 5.8% |
| Creek | 3.1 /100 | #232 | Tragic 5.8% |
| Spanish Americans | 3.1 /100 | #233 | Tragic 5.8% |
| Guamanians/Chamorros | 2.9 /100 | #234 | Tragic 5.8% |
| Immigrants | Middle Africa | 2.8 /100 | #235 | Tragic 5.8% |
Demographics Similar to Immigrants from Korea by Unemployment Among Women with Children Under 18 years
In terms of unemployment among women with children under 18 years, the demographic groups most similar to Immigrants from Korea are Immigrants from Malaysia (5.0%, a difference of 0.11%), British (5.0%, a difference of 0.13%), Immigrants from Moldova (5.0%, a difference of 0.20%), Northern European (5.0%, a difference of 0.25%), and Turkish (5.0%, a difference of 0.26%).
| Demographics | Rating | Rank | Unemployment Among Women with Children Under 18 years |
| English | 99.1 /100 | #39 | Exceptional 5.0% |
| Greeks | 99.0 /100 | #40 | Exceptional 5.0% |
| Immigrants | Bosnia and Herzegovina | 99.0 /100 | #41 | Exceptional 5.0% |
| Eastern Europeans | 98.9 /100 | #42 | Exceptional 5.0% |
| Turks | 98.9 /100 | #43 | Exceptional 5.0% |
| Immigrants | Moldova | 98.9 /100 | #44 | Exceptional 5.0% |
| Immigrants | Malaysia | 98.8 /100 | #45 | Exceptional 5.0% |
| Immigrants | Korea | 98.7 /100 | #46 | Exceptional 5.0% |
| British | 98.7 /100 | #47 | Exceptional 5.0% |
| Northern Europeans | 98.6 /100 | #48 | Exceptional 5.0% |
| Lithuanians | 98.4 /100 | #49 | Exceptional 5.0% |
| Immigrants | Japan | 98.4 /100 | #50 | Exceptional 5.0% |
| Yugoslavians | 98.3 /100 | #51 | Exceptional 5.1% |
| Immigrants | Nepal | 98.3 /100 | #52 | Exceptional 5.1% |
| Scottish | 98.2 /100 | #53 | Exceptional 5.1% |