Slovak vs Lebanese Per Capita Income
COMPARE
Slovak
Lebanese
Per Capita Income
Per Capita Income Comparison
Slovaks
Lebanese
$44,229
PER CAPITA INCOME
65.4/ 100
METRIC RATING
156th/ 347
METRIC RANK
$45,840
PER CAPITA INCOME
92.0/ 100
METRIC RATING
123rd/ 347
METRIC RANK
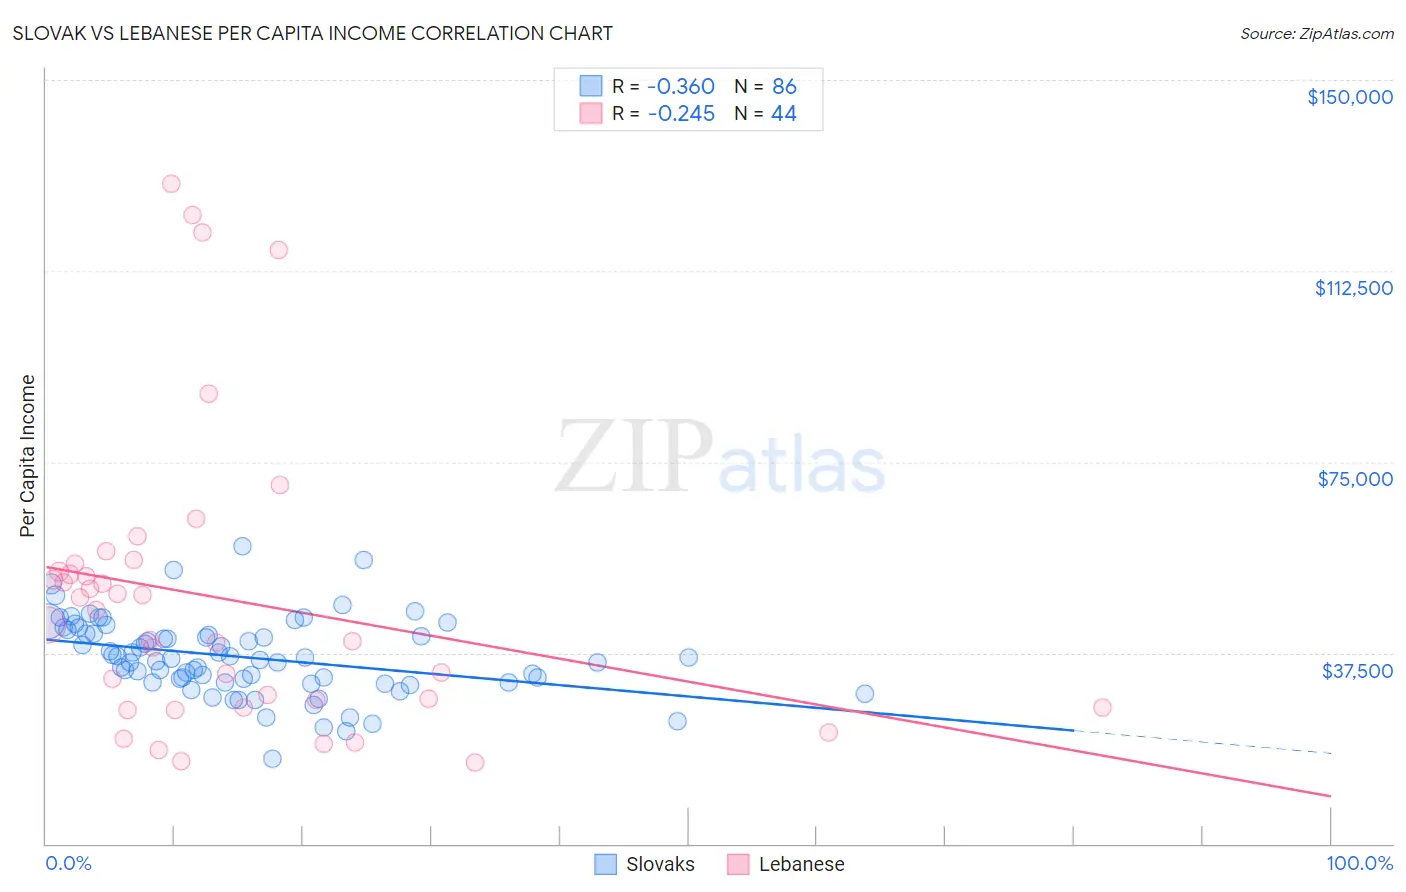
Slovak vs Lebanese Per Capita Income Correlation Chart
The statistical analysis conducted on geographies consisting of 397,898,984 people shows a mild negative correlation between the proportion of Slovaks and per capita income in the United States with a correlation coefficient (R) of -0.360 and weighted average of $44,229. Similarly, the statistical analysis conducted on geographies consisting of 401,645,404 people shows a weak negative correlation between the proportion of Lebanese and per capita income in the United States with a correlation coefficient (R) of -0.245 and weighted average of $45,840, a difference of 3.6%.
Per Capita Income Correlation Summary
| Measurement | Slovak | Lebanese |
| Minimum | $16,734 | $15,839 |
| Maximum | $58,546 | $129,581 |
| Range | $41,812 | $113,742 |
| Mean | $36,677 | $48,201 |
| Median | $36,437 | $44,395 |
| Interquartile 25% (IQ1) | $31,763 | $27,415 |
| Interquartile 75% (IQ3) | $41,360 | $54,286 |
| Interquartile Range (IQR) | $9,597 | $26,871 |
| Standard Deviation (Sample) | $7,565 | $28,531 |
| Standard Deviation (Population) | $7,521 | $28,205 |
Similar Demographics by Per Capita Income
Demographics Similar to Slovaks by Per Capita Income
In terms of per capita income, the demographic groups most similar to Slovaks are South American Indian ($44,206, a difference of 0.050%), Immigrants from Nepal ($44,187, a difference of 0.090%), Uruguayan ($44,318, a difference of 0.20%), South American ($44,114, a difference of 0.26%), and Portuguese ($44,362, a difference of 0.30%).
| Demographics | Rating | Rank | Per Capita Income |
| Koreans | 72.5 /100 | #149 | Good $44,522 |
| Immigrants | Eritrea | 72.1 /100 | #150 | Good $44,509 |
| Norwegians | 71.5 /100 | #151 | Good $44,480 |
| Peruvians | 71.5 /100 | #152 | Good $44,479 |
| Scottish | 70.6 /100 | #153 | Good $44,440 |
| Portuguese | 68.7 /100 | #154 | Good $44,362 |
| Uruguayans | 67.6 /100 | #155 | Good $44,318 |
| Slovaks | 65.4 /100 | #156 | Good $44,229 |
| South American Indians | 64.8 /100 | #157 | Good $44,206 |
| Immigrants | Nepal | 64.3 /100 | #158 | Good $44,187 |
| South Americans | 62.4 /100 | #159 | Good $44,114 |
| Danes | 61.9 /100 | #160 | Good $44,095 |
| Costa Ricans | 61.8 /100 | #161 | Good $44,090 |
| Swiss | 61.4 /100 | #162 | Good $44,076 |
| Immigrants | South America | 61.2 /100 | #163 | Good $44,068 |
Demographics Similar to Lebanese by Per Capita Income
In terms of per capita income, the demographic groups most similar to Lebanese are European ($45,836, a difference of 0.010%), Moroccan ($45,854, a difference of 0.030%), Canadian ($45,858, a difference of 0.040%), Zimbabwean ($45,804, a difference of 0.080%), and Palestinian ($45,790, a difference of 0.11%).
| Demographics | Rating | Rank | Per Capita Income |
| Poles | 94.1 /100 | #116 | Exceptional $46,123 |
| Chinese | 93.9 /100 | #117 | Exceptional $46,098 |
| Immigrants | Saudi Arabia | 93.3 /100 | #118 | Exceptional $46,008 |
| Immigrants | Poland | 93.1 /100 | #119 | Exceptional $45,979 |
| Immigrants | Ethiopia | 92.7 /100 | #120 | Exceptional $45,923 |
| Canadians | 92.2 /100 | #121 | Exceptional $45,858 |
| Moroccans | 92.1 /100 | #122 | Exceptional $45,854 |
| Lebanese | 92.0 /100 | #123 | Exceptional $45,840 |
| Europeans | 92.0 /100 | #124 | Exceptional $45,836 |
| Zimbabweans | 91.7 /100 | #125 | Exceptional $45,804 |
| Palestinians | 91.6 /100 | #126 | Exceptional $45,790 |
| Immigrants | Germany | 91.3 /100 | #127 | Exceptional $45,751 |
| Swedes | 91.3 /100 | #128 | Exceptional $45,750 |
| Luxembourgers | 90.4 /100 | #129 | Exceptional $45,663 |
| Arabs | 90.4 /100 | #130 | Exceptional $45,662 |