Slovak vs Spanish Median Earnings
COMPARE
Slovak
Spanish
Median Earnings
Median Earnings Comparison
Slovaks
Spanish
$47,095
MEDIAN EARNINGS
71.7/ 100
METRIC RATING
158th/ 347
METRIC RANK
$45,432
MEDIAN EARNINGS
19.7/ 100
METRIC RATING
218th/ 347
METRIC RANK
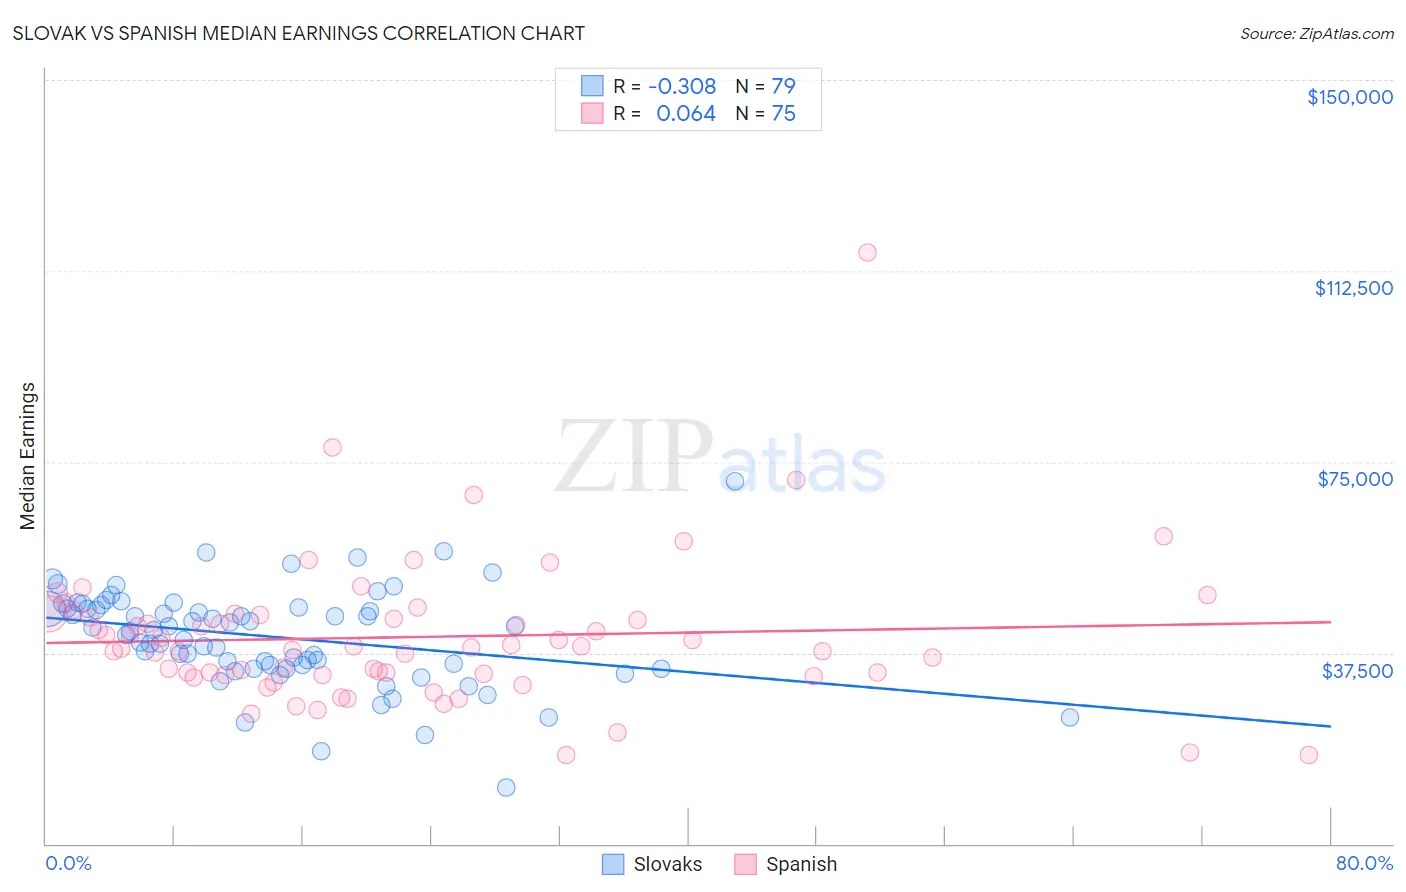
Slovak vs Spanish Median Earnings Correlation Chart
The statistical analysis conducted on geographies consisting of 397,848,187 people shows a mild negative correlation between the proportion of Slovaks and median earnings in the United States with a correlation coefficient (R) of -0.308 and weighted average of $47,095. Similarly, the statistical analysis conducted on geographies consisting of 422,139,772 people shows a slight positive correlation between the proportion of Spanish and median earnings in the United States with a correlation coefficient (R) of 0.064 and weighted average of $45,432, a difference of 3.7%.
Median Earnings Correlation Summary
| Measurement | Slovak | Spanish |
| Minimum | $11,076 | $17,367 |
| Maximum | $71,150 | $116,081 |
| Range | $60,074 | $98,714 |
| Mean | $40,661 | $40,595 |
| Median | $41,901 | $38,434 |
| Interquartile 25% (IQ1) | $35,020 | $33,070 |
| Interquartile 75% (IQ3) | $46,429 | $44,875 |
| Interquartile Range (IQR) | $11,409 | $11,804 |
| Standard Deviation (Sample) | $9,606 | $14,293 |
| Standard Deviation (Population) | $9,545 | $14,198 |
Similar Demographics by Median Earnings
Demographics Similar to Slovaks by Median Earnings
In terms of median earnings, the demographic groups most similar to Slovaks are Immigrants from Peru ($47,025, a difference of 0.15%), Alsatian ($47,023, a difference of 0.15%), Czech ($47,221, a difference of 0.27%), Immigrants from Eastern Africa ($46,969, a difference of 0.27%), and South American Indian ($46,952, a difference of 0.31%).
| Demographics | Rating | Rank | Median Earnings |
| Immigrants | Oceania | 84.1 /100 | #151 | Excellent $47,617 |
| Immigrants | Germany | 83.1 /100 | #152 | Excellent $47,566 |
| Slavs | 81.1 /100 | #153 | Excellent $47,470 |
| Immigrants | Portugal | 77.3 /100 | #154 | Good $47,304 |
| Immigrants | Vietnam | 76.7 /100 | #155 | Good $47,282 |
| Irish | 76.6 /100 | #156 | Good $47,276 |
| Czechs | 75.1 /100 | #157 | Good $47,221 |
| Slovaks | 71.7 /100 | #158 | Good $47,095 |
| Immigrants | Peru | 69.6 /100 | #159 | Good $47,025 |
| Alsatians | 69.6 /100 | #160 | Good $47,023 |
| Immigrants | Eastern Africa | 68.0 /100 | #161 | Good $46,969 |
| South American Indians | 67.4 /100 | #162 | Good $46,952 |
| Icelanders | 66.3 /100 | #163 | Good $46,916 |
| Norwegians | 64.7 /100 | #164 | Good $46,865 |
| South Americans | 62.7 /100 | #165 | Good $46,804 |
Demographics Similar to Spanish by Median Earnings
In terms of median earnings, the demographic groups most similar to Spanish are Guyanese ($45,470, a difference of 0.080%), Tlingit-Haida ($45,468, a difference of 0.080%), Dutch ($45,370, a difference of 0.14%), Nigerian ($45,532, a difference of 0.22%), and Immigrants from Bangladesh ($45,532, a difference of 0.22%).
| Demographics | Rating | Rank | Median Earnings |
| Panamanians | 23.5 /100 | #211 | Fair $45,593 |
| Bermudans | 23.5 /100 | #212 | Fair $45,593 |
| Immigrants | Colombia | 22.4 /100 | #213 | Fair $45,550 |
| Nigerians | 22.0 /100 | #214 | Fair $45,532 |
| Immigrants | Bangladesh | 22.0 /100 | #215 | Fair $45,532 |
| Guyanese | 20.6 /100 | #216 | Fair $45,470 |
| Tlingit-Haida | 20.5 /100 | #217 | Fair $45,468 |
| Spanish | 19.7 /100 | #218 | Poor $45,432 |
| Dutch | 18.4 /100 | #219 | Poor $45,370 |
| Ecuadorians | 15.3 /100 | #220 | Poor $45,214 |
| Immigrants | Guyana | 15.1 /100 | #221 | Poor $45,204 |
| Immigrants | Panama | 15.0 /100 | #222 | Poor $45,198 |
| Whites/Caucasians | 15.0 /100 | #223 | Poor $45,197 |
| West Indians | 13.9 /100 | #224 | Poor $45,132 |
| Immigrants | Cambodia | 13.2 /100 | #225 | Poor $45,090 |