Immigrants from South America vs Scotch-Irish Householder Income Ages 25 - 44 years
COMPARE
Immigrants from South America
Scotch-Irish
Householder Income Ages 25 - 44 years
Householder Income Ages 25 - 44 years Comparison
Immigrants from South America
Scotch-Irish
$94,042
HOUSEHOLDER INCOME AGES 25 - 44 YEARS
42.8/ 100
METRIC RATING
178th/ 347
METRIC RANK
$89,969
HOUSEHOLDER INCOME AGES 25 - 44 YEARS
7.3/ 100
METRIC RATING
217th/ 347
METRIC RANK
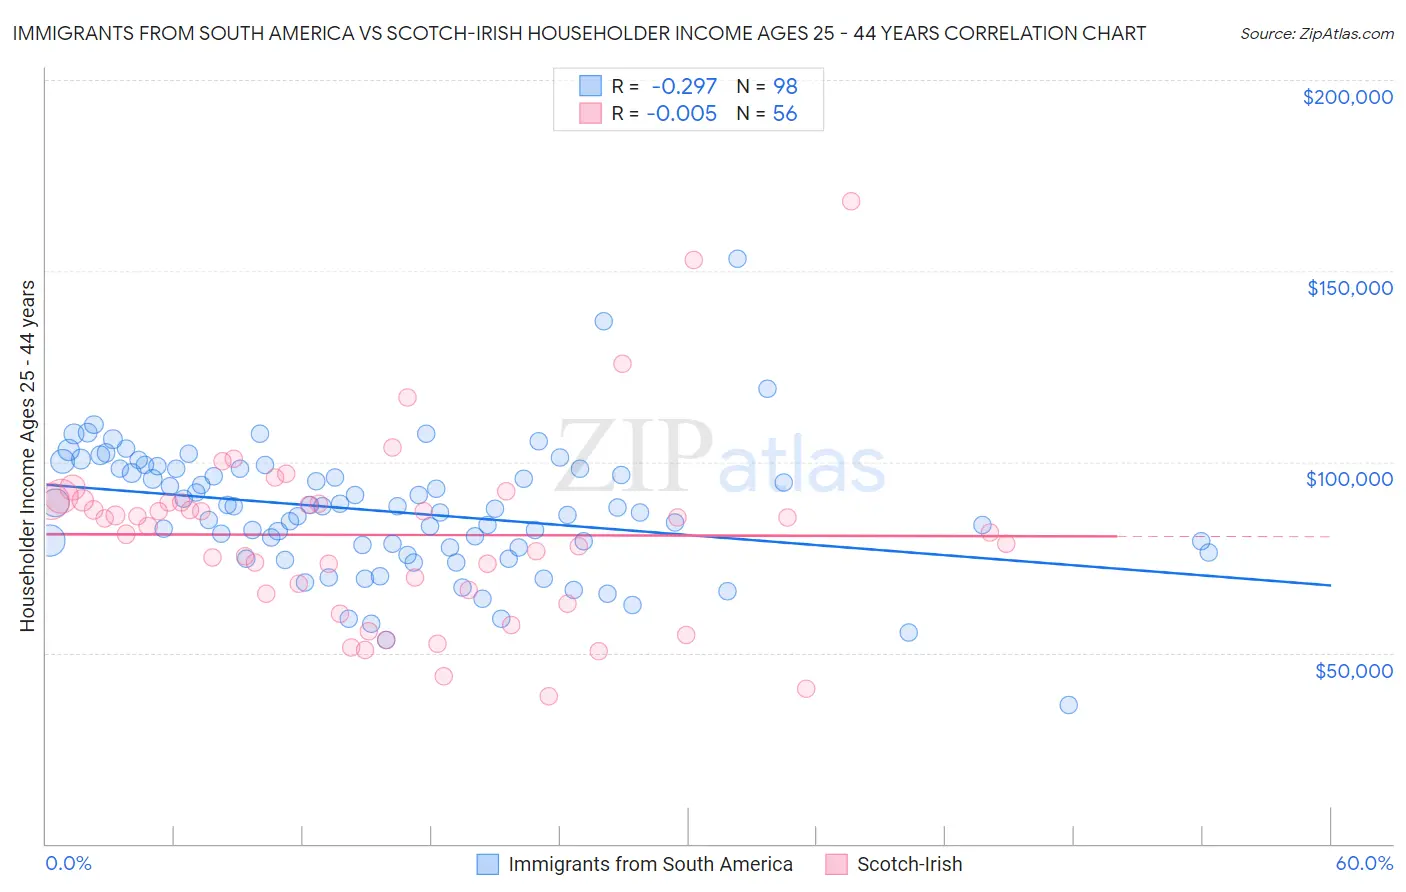
Immigrants from South America vs Scotch-Irish Householder Income Ages 25 - 44 years Correlation Chart
The statistical analysis conducted on geographies consisting of 484,511,014 people shows a weak negative correlation between the proportion of Immigrants from South America and household income with householder between the ages 25 and 44 in the United States with a correlation coefficient (R) of -0.297 and weighted average of $94,042. Similarly, the statistical analysis conducted on geographies consisting of 544,063,779 people shows no correlation between the proportion of Scotch-Irish and household income with householder between the ages 25 and 44 in the United States with a correlation coefficient (R) of -0.005 and weighted average of $89,969, a difference of 4.5%.
Householder Income Ages 25 - 44 years Correlation Summary
| Measurement | Immigrants from South America | Scotch-Irish |
| Minimum | $36,176 | $38,615 |
| Maximum | $153,313 | $168,086 |
| Range | $117,137 | $129,471 |
| Mean | $86,995 | $80,873 |
| Median | $87,907 | $84,225 |
| Interquartile 25% (IQ1) | $77,429 | $65,999 |
| Interquartile 75% (IQ3) | $98,212 | $89,511 |
| Interquartile Range (IQR) | $20,783 | $23,512 |
| Standard Deviation (Sample) | $16,981 | $23,988 |
| Standard Deviation (Population) | $16,895 | $23,773 |
Similar Demographics by Householder Income Ages 25 - 44 years
Demographics Similar to Immigrants from South America by Householder Income Ages 25 - 44 years
In terms of householder income ages 25 - 44 years, the demographic groups most similar to Immigrants from South America are Belgian ($94,262, a difference of 0.23%), French Canadian ($93,694, a difference of 0.37%), Immigrants ($94,423, a difference of 0.40%), French ($93,665, a difference of 0.40%), and English ($94,429, a difference of 0.41%).
| Demographics | Rating | Rank | Householder Income Ages 25 - 44 years |
| Immigrants | Armenia | 54.2 /100 | #171 | Average $94,867 |
| Scottish | 50.8 /100 | #172 | Average $94,622 |
| Finns | 50.6 /100 | #173 | Average $94,610 |
| Colombians | 50.0 /100 | #174 | Average $94,565 |
| English | 48.1 /100 | #175 | Average $94,429 |
| Immigrants | Immigrants | 48.0 /100 | #176 | Average $94,423 |
| Belgians | 45.8 /100 | #177 | Average $94,262 |
| Immigrants | South America | 42.8 /100 | #178 | Average $94,042 |
| French Canadians | 38.2 /100 | #179 | Fair $93,694 |
| French | 37.8 /100 | #180 | Fair $93,665 |
| Puget Sound Salish | 37.7 /100 | #181 | Fair $93,661 |
| Uruguayans | 37.3 /100 | #182 | Fair $93,631 |
| Guamanians/Chamorros | 36.5 /100 | #183 | Fair $93,569 |
| Germans | 36.0 /100 | #184 | Fair $93,531 |
| Immigrants | Eritrea | 35.2 /100 | #185 | Fair $93,466 |
Demographics Similar to Scotch-Irish by Householder Income Ages 25 - 44 years
In terms of householder income ages 25 - 44 years, the demographic groups most similar to Scotch-Irish are Guyanese ($89,940, a difference of 0.030%), Delaware ($89,876, a difference of 0.10%), Trinidadian and Tobagonian ($89,856, a difference of 0.13%), Ghanaian ($90,137, a difference of 0.19%), and Panamanian ($90,193, a difference of 0.25%).
| Demographics | Rating | Rank | Householder Income Ages 25 - 44 years |
| Immigrants | Kenya | 10.9 /100 | #210 | Poor $90,767 |
| Iraqis | 10.8 /100 | #211 | Poor $90,764 |
| Hawaiians | 10.6 /100 | #212 | Poor $90,722 |
| Immigrants | Bangladesh | 9.3 /100 | #213 | Tragic $90,448 |
| Immigrants | Africa | 8.9 /100 | #214 | Tragic $90,372 |
| Panamanians | 8.1 /100 | #215 | Tragic $90,193 |
| Ghanaians | 7.9 /100 | #216 | Tragic $90,137 |
| Scotch-Irish | 7.3 /100 | #217 | Tragic $89,969 |
| Guyanese | 7.1 /100 | #218 | Tragic $89,940 |
| Delaware | 6.9 /100 | #219 | Tragic $89,876 |
| Trinidadians and Tobagonians | 6.8 /100 | #220 | Tragic $89,856 |
| Immigrants | Trinidad and Tobago | 6.5 /100 | #221 | Tragic $89,748 |
| Immigrants | Ecuador | 6.2 /100 | #222 | Tragic $89,673 |
| Immigrants | Guyana | 5.9 /100 | #223 | Tragic $89,586 |
| Barbadians | 5.9 /100 | #224 | Tragic $89,565 |