Jordanian vs Scotch-Irish Householder Income Ages 25 - 44 years
COMPARE
Jordanian
Scotch-Irish
Householder Income Ages 25 - 44 years
Householder Income Ages 25 - 44 years Comparison
Jordanians
Scotch-Irish
$99,186
HOUSEHOLDER INCOME AGES 25 - 44 YEARS
92.8/ 100
METRIC RATING
119th/ 347
METRIC RANK
$89,969
HOUSEHOLDER INCOME AGES 25 - 44 YEARS
7.3/ 100
METRIC RATING
217th/ 347
METRIC RANK
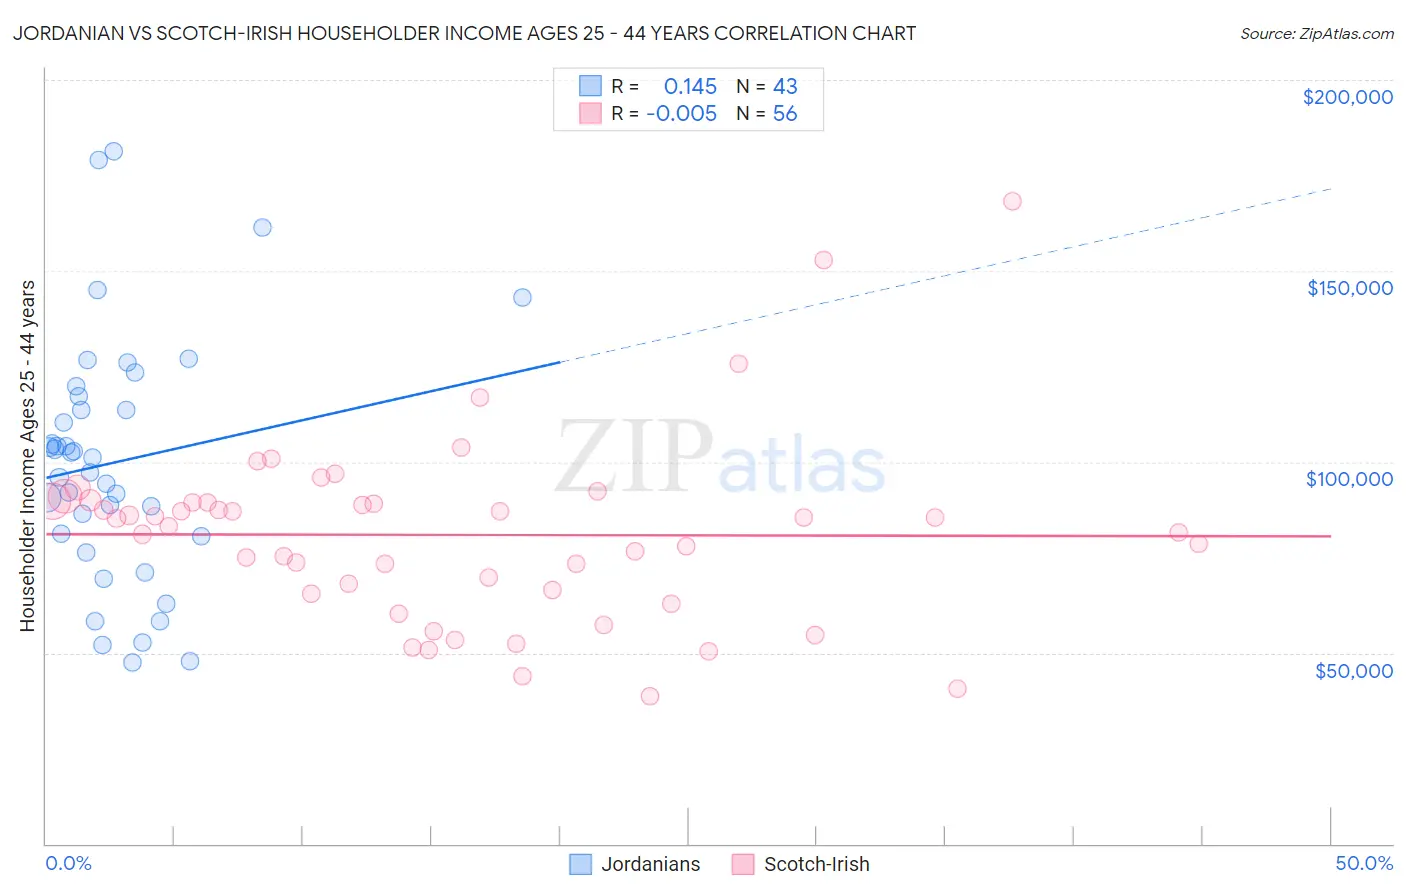
Jordanian vs Scotch-Irish Householder Income Ages 25 - 44 years Correlation Chart
The statistical analysis conducted on geographies consisting of 166,327,979 people shows a poor positive correlation between the proportion of Jordanians and household income with householder between the ages 25 and 44 in the United States with a correlation coefficient (R) of 0.145 and weighted average of $99,186. Similarly, the statistical analysis conducted on geographies consisting of 544,063,779 people shows no correlation between the proportion of Scotch-Irish and household income with householder between the ages 25 and 44 in the United States with a correlation coefficient (R) of -0.005 and weighted average of $89,969, a difference of 10.2%.
Householder Income Ages 25 - 44 years Correlation Summary
| Measurement | Jordanian | Scotch-Irish |
| Minimum | $47,305 | $38,615 |
| Maximum | $181,494 | $168,086 |
| Range | $134,189 | $129,471 |
| Mean | $99,931 | $80,873 |
| Median | $101,206 | $84,225 |
| Interquartile 25% (IQ1) | $80,556 | $65,999 |
| Interquartile 75% (IQ3) | $117,253 | $89,511 |
| Interquartile Range (IQR) | $36,697 | $23,512 |
| Standard Deviation (Sample) | $32,051 | $23,988 |
| Standard Deviation (Population) | $31,676 | $23,773 |
Similar Demographics by Householder Income Ages 25 - 44 years
Demographics Similar to Jordanians by Householder Income Ages 25 - 44 years
In terms of householder income ages 25 - 44 years, the demographic groups most similar to Jordanians are Syrian ($99,215, a difference of 0.030%), Immigrants from Northern Africa ($99,232, a difference of 0.050%), Swedish ($99,136, a difference of 0.050%), Portuguese ($99,429, a difference of 0.24%), and Carpatho Rusyn ($99,449, a difference of 0.27%).
| Demographics | Rating | Rank | Householder Income Ages 25 - 44 years |
| Poles | 94.5 /100 | #112 | Exceptional $99,685 |
| Tongans | 94.2 /100 | #113 | Exceptional $99,604 |
| Immigrants | Western Asia | 94.0 /100 | #114 | Exceptional $99,516 |
| Carpatho Rusyns | 93.7 /100 | #115 | Exceptional $99,449 |
| Portuguese | 93.7 /100 | #116 | Exceptional $99,429 |
| Immigrants | Northern Africa | 93.0 /100 | #117 | Exceptional $99,232 |
| Syrians | 92.9 /100 | #118 | Exceptional $99,215 |
| Jordanians | 92.8 /100 | #119 | Exceptional $99,186 |
| Swedes | 92.7 /100 | #120 | Exceptional $99,136 |
| Peruvians | 91.7 /100 | #121 | Exceptional $98,886 |
| Immigrants | Uzbekistan | 91.5 /100 | #122 | Exceptional $98,849 |
| Palestinians | 91.2 /100 | #123 | Exceptional $98,777 |
| Zimbabweans | 90.3 /100 | #124 | Exceptional $98,586 |
| Pakistanis | 89.3 /100 | #125 | Excellent $98,401 |
| British | 89.1 /100 | #126 | Excellent $98,359 |
Demographics Similar to Scotch-Irish by Householder Income Ages 25 - 44 years
In terms of householder income ages 25 - 44 years, the demographic groups most similar to Scotch-Irish are Guyanese ($89,940, a difference of 0.030%), Delaware ($89,876, a difference of 0.10%), Trinidadian and Tobagonian ($89,856, a difference of 0.13%), Ghanaian ($90,137, a difference of 0.19%), and Panamanian ($90,193, a difference of 0.25%).
| Demographics | Rating | Rank | Householder Income Ages 25 - 44 years |
| Immigrants | Kenya | 10.9 /100 | #210 | Poor $90,767 |
| Iraqis | 10.8 /100 | #211 | Poor $90,764 |
| Hawaiians | 10.6 /100 | #212 | Poor $90,722 |
| Immigrants | Bangladesh | 9.3 /100 | #213 | Tragic $90,448 |
| Immigrants | Africa | 8.9 /100 | #214 | Tragic $90,372 |
| Panamanians | 8.1 /100 | #215 | Tragic $90,193 |
| Ghanaians | 7.9 /100 | #216 | Tragic $90,137 |
| Scotch-Irish | 7.3 /100 | #217 | Tragic $89,969 |
| Guyanese | 7.1 /100 | #218 | Tragic $89,940 |
| Delaware | 6.9 /100 | #219 | Tragic $89,876 |
| Trinidadians and Tobagonians | 6.8 /100 | #220 | Tragic $89,856 |
| Immigrants | Trinidad and Tobago | 6.5 /100 | #221 | Tragic $89,748 |
| Immigrants | Ecuador | 6.2 /100 | #222 | Tragic $89,673 |
| Immigrants | Guyana | 5.9 /100 | #223 | Tragic $89,586 |
| Barbadians | 5.9 /100 | #224 | Tragic $89,565 |