Immigrants from Kazakhstan vs Scotch-Irish Householder Income Ages 25 - 44 years
COMPARE
Immigrants from Kazakhstan
Scotch-Irish
Householder Income Ages 25 - 44 years
Householder Income Ages 25 - 44 years Comparison
Immigrants from Kazakhstan
Scotch-Irish
$101,727
HOUSEHOLDER INCOME AGES 25 - 44 YEARS
98.1/ 100
METRIC RATING
98th/ 347
METRIC RANK
$89,969
HOUSEHOLDER INCOME AGES 25 - 44 YEARS
7.3/ 100
METRIC RATING
217th/ 347
METRIC RANK
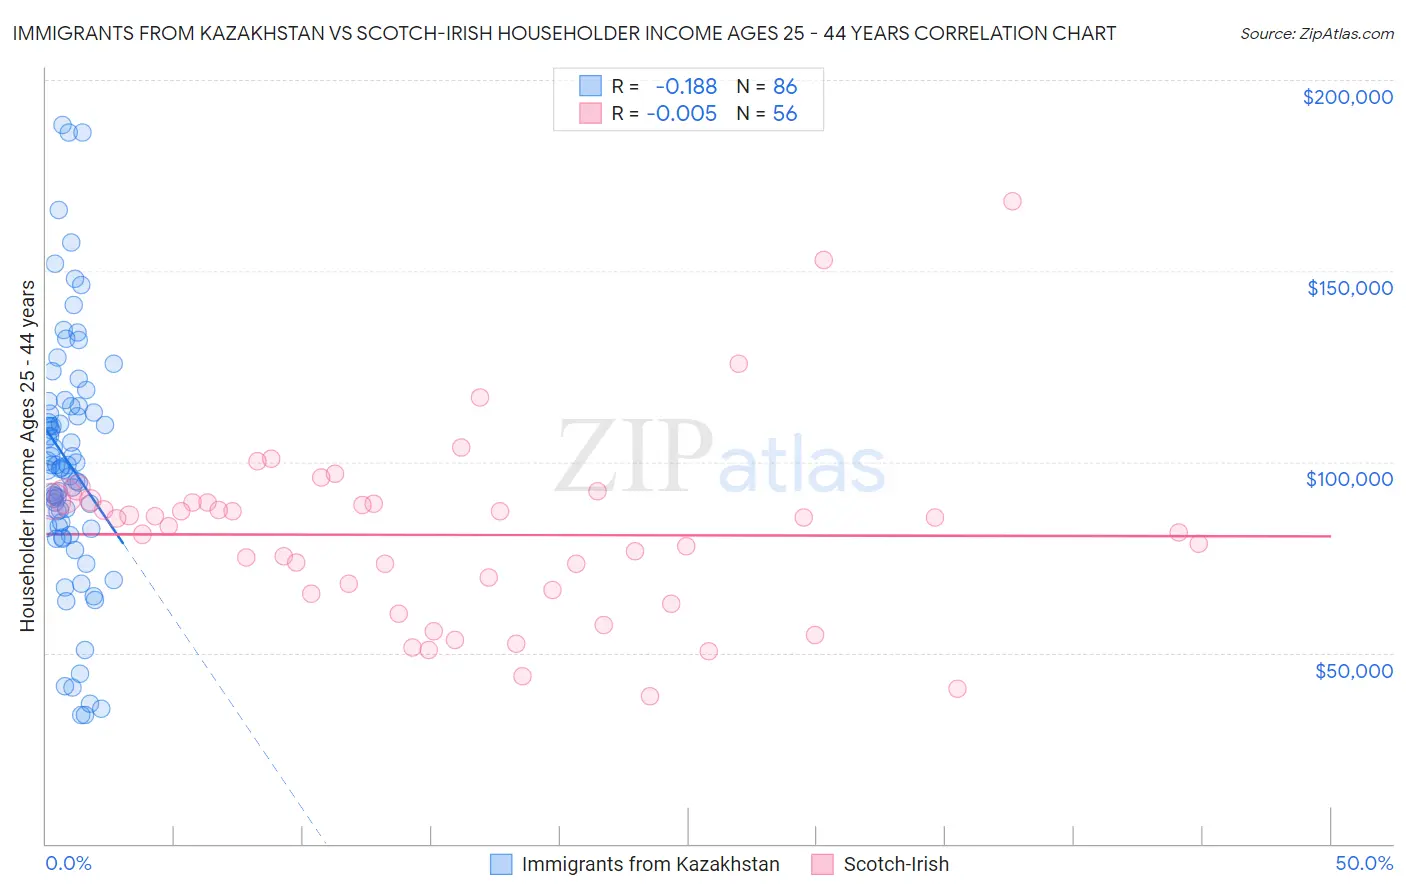
Immigrants from Kazakhstan vs Scotch-Irish Householder Income Ages 25 - 44 years Correlation Chart
The statistical analysis conducted on geographies consisting of 124,395,234 people shows a poor negative correlation between the proportion of Immigrants from Kazakhstan and household income with householder between the ages 25 and 44 in the United States with a correlation coefficient (R) of -0.188 and weighted average of $101,727. Similarly, the statistical analysis conducted on geographies consisting of 544,063,779 people shows no correlation between the proportion of Scotch-Irish and household income with householder between the ages 25 and 44 in the United States with a correlation coefficient (R) of -0.005 and weighted average of $89,969, a difference of 13.1%.
Householder Income Ages 25 - 44 years Correlation Summary
| Measurement | Immigrants from Kazakhstan | Scotch-Irish |
| Minimum | $33,710 | $38,615 |
| Maximum | $188,234 | $168,086 |
| Range | $154,524 | $129,471 |
| Mean | $99,834 | $80,873 |
| Median | $98,784 | $84,225 |
| Interquartile 25% (IQ1) | $83,191 | $65,999 |
| Interquartile 75% (IQ3) | $114,592 | $89,511 |
| Interquartile Range (IQR) | $31,401 | $23,512 |
| Standard Deviation (Sample) | $32,549 | $23,988 |
| Standard Deviation (Population) | $32,360 | $23,773 |
Similar Demographics by Householder Income Ages 25 - 44 years
Demographics Similar to Immigrants from Kazakhstan by Householder Income Ages 25 - 44 years
In terms of householder income ages 25 - 44 years, the demographic groups most similar to Immigrants from Kazakhstan are Austrian ($101,842, a difference of 0.11%), Macedonian ($101,882, a difference of 0.15%), Assyrian/Chaldean/Syriac ($101,936, a difference of 0.21%), Sri Lankan ($101,960, a difference of 0.23%), and Taiwanese ($101,492, a difference of 0.23%).
| Demographics | Rating | Rank | Householder Income Ages 25 - 44 years |
| Croatians | 98.7 /100 | #91 | Exceptional $102,414 |
| Immigrants | North America | 98.7 /100 | #92 | Exceptional $102,407 |
| Immigrants | England | 98.4 /100 | #93 | Exceptional $102,020 |
| Sri Lankans | 98.4 /100 | #94 | Exceptional $101,960 |
| Assyrians/Chaldeans/Syriacs | 98.3 /100 | #95 | Exceptional $101,936 |
| Macedonians | 98.3 /100 | #96 | Exceptional $101,882 |
| Austrians | 98.3 /100 | #97 | Exceptional $101,842 |
| Immigrants | Kazakhstan | 98.1 /100 | #98 | Exceptional $101,727 |
| Taiwanese | 97.9 /100 | #99 | Exceptional $101,492 |
| Immigrants | Argentina | 97.8 /100 | #100 | Exceptional $101,415 |
| Albanians | 97.8 /100 | #101 | Exceptional $101,367 |
| Immigrants | Lebanon | 97.4 /100 | #102 | Exceptional $101,124 |
| Immigrants | Moldova | 97.4 /100 | #103 | Exceptional $101,091 |
| Immigrants | Poland | 97.4 /100 | #104 | Exceptional $101,065 |
| Immigrants | Vietnam | 96.5 /100 | #105 | Exceptional $100,535 |
Demographics Similar to Scotch-Irish by Householder Income Ages 25 - 44 years
In terms of householder income ages 25 - 44 years, the demographic groups most similar to Scotch-Irish are Guyanese ($89,940, a difference of 0.030%), Delaware ($89,876, a difference of 0.10%), Trinidadian and Tobagonian ($89,856, a difference of 0.13%), Ghanaian ($90,137, a difference of 0.19%), and Panamanian ($90,193, a difference of 0.25%).
| Demographics | Rating | Rank | Householder Income Ages 25 - 44 years |
| Immigrants | Kenya | 10.9 /100 | #210 | Poor $90,767 |
| Iraqis | 10.8 /100 | #211 | Poor $90,764 |
| Hawaiians | 10.6 /100 | #212 | Poor $90,722 |
| Immigrants | Bangladesh | 9.3 /100 | #213 | Tragic $90,448 |
| Immigrants | Africa | 8.9 /100 | #214 | Tragic $90,372 |
| Panamanians | 8.1 /100 | #215 | Tragic $90,193 |
| Ghanaians | 7.9 /100 | #216 | Tragic $90,137 |
| Scotch-Irish | 7.3 /100 | #217 | Tragic $89,969 |
| Guyanese | 7.1 /100 | #218 | Tragic $89,940 |
| Delaware | 6.9 /100 | #219 | Tragic $89,876 |
| Trinidadians and Tobagonians | 6.8 /100 | #220 | Tragic $89,856 |
| Immigrants | Trinidad and Tobago | 6.5 /100 | #221 | Tragic $89,748 |
| Immigrants | Ecuador | 6.2 /100 | #222 | Tragic $89,673 |
| Immigrants | Guyana | 5.9 /100 | #223 | Tragic $89,586 |
| Barbadians | 5.9 /100 | #224 | Tragic $89,565 |