Slavic vs Italian Seniors Poverty Over the Age of 75
COMPARE
Slavic
Italian
Seniors Poverty Over the Age of 75
Seniors Poverty Over the Age of 75 Comparison
Slavs
Italians
11.2%
SENIORS POVERTY OVER THE AGE OF 75
98.1/ 100
METRIC RATING
56th/ 347
METRIC RANK
10.8%
SENIORS POVERTY OVER THE AGE OF 75
99.7/ 100
METRIC RATING
34th/ 347
METRIC RANK
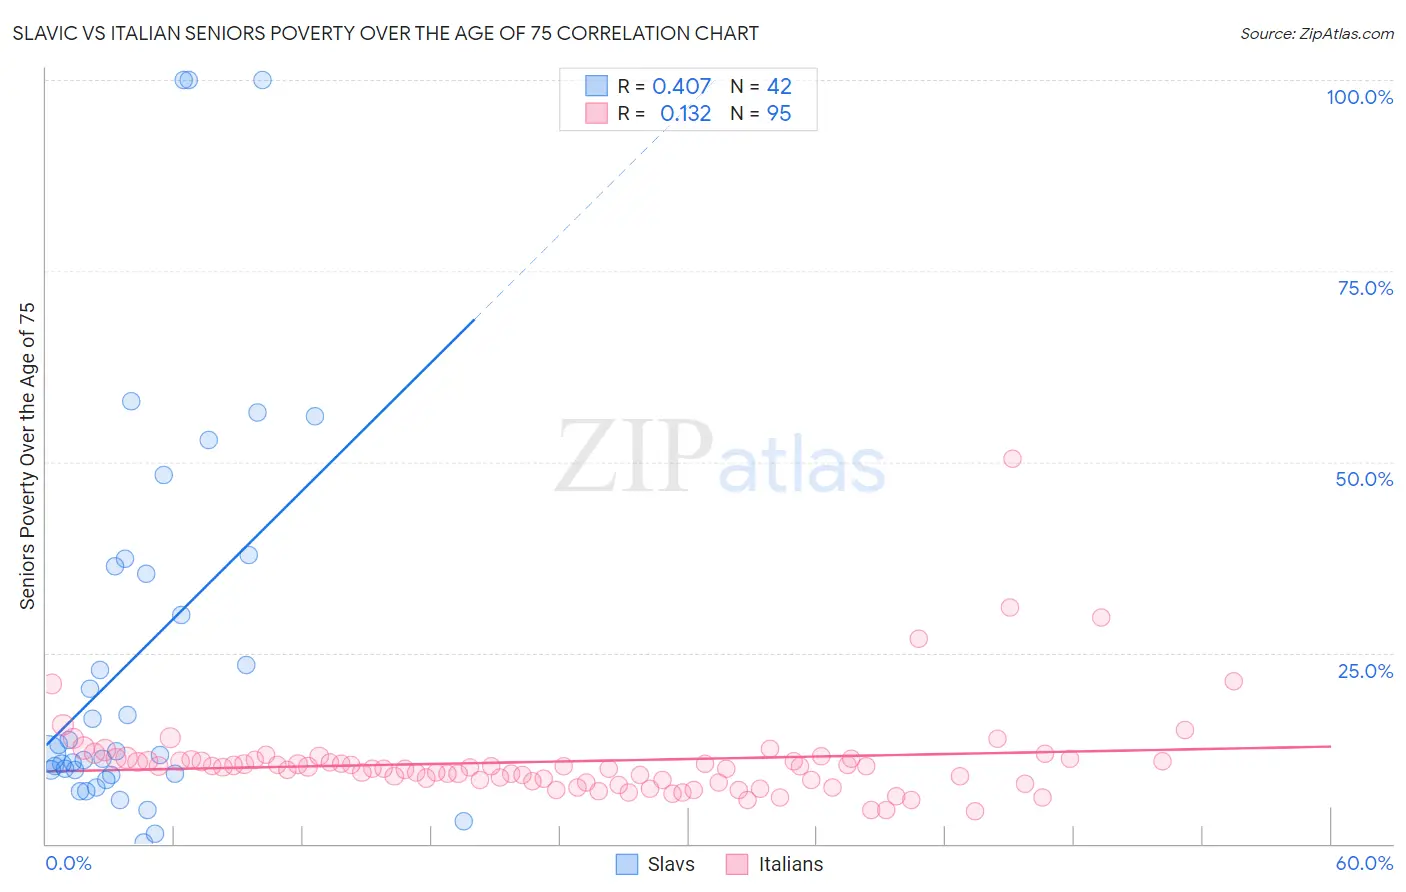
Slavic vs Italian Seniors Poverty Over the Age of 75 Correlation Chart
The statistical analysis conducted on geographies consisting of 268,817,637 people shows a moderate positive correlation between the proportion of Slavs and poverty level among seniors over the age of 75 in the United States with a correlation coefficient (R) of 0.407 and weighted average of 11.2%. Similarly, the statistical analysis conducted on geographies consisting of 557,339,767 people shows a poor positive correlation between the proportion of Italians and poverty level among seniors over the age of 75 in the United States with a correlation coefficient (R) of 0.132 and weighted average of 10.8%, a difference of 4.2%.
Seniors Poverty Over the Age of 75 Correlation Summary
| Measurement | Slavic | Italian |
| Minimum | 0.17% | 4.3% |
| Maximum | 100.0% | 50.4% |
| Range | 99.8% | 46.0% |
| Mean | 25.1% | 10.8% |
| Median | 12.0% | 10.0% |
| Interquartile 25% (IQ1) | 9.1% | 8.3% |
| Interquartile 75% (IQ3) | 36.4% | 11.0% |
| Interquartile Range (IQR) | 27.3% | 2.8% |
| Standard Deviation (Sample) | 26.5% | 6.0% |
| Standard Deviation (Population) | 26.1% | 6.0% |
Similar Demographics by Seniors Poverty Over the Age of 75
Demographics Similar to Slavs by Seniors Poverty Over the Age of 75
In terms of seniors poverty over the age of 75, the demographic groups most similar to Slavs are Hungarian (11.2%, a difference of 0.010%), Afghan (11.2%, a difference of 0.090%), Immigrants from Canada (11.2%, a difference of 0.23%), Yugoslavian (11.2%, a difference of 0.27%), and Immigrants from Netherlands (11.2%, a difference of 0.35%).
| Demographics | Rating | Rank | Seniors Poverty Over the Age of 75 |
| Samoans | 98.7 /100 | #49 | Exceptional 11.1% |
| Serbians | 98.6 /100 | #50 | Exceptional 11.1% |
| Immigrants | North Macedonia | 98.6 /100 | #51 | Exceptional 11.1% |
| Zimbabweans | 98.5 /100 | #52 | Exceptional 11.2% |
| Immigrants | England | 98.4 /100 | #53 | Exceptional 11.2% |
| Afghans | 98.2 /100 | #54 | Exceptional 11.2% |
| Hungarians | 98.1 /100 | #55 | Exceptional 11.2% |
| Slavs | 98.1 /100 | #56 | Exceptional 11.2% |
| Immigrants | Canada | 97.9 /100 | #57 | Exceptional 11.2% |
| Yugoslavians | 97.9 /100 | #58 | Exceptional 11.2% |
| Immigrants | Netherlands | 97.8 /100 | #59 | Exceptional 11.2% |
| Eastern Europeans | 97.7 /100 | #60 | Exceptional 11.3% |
| Canadians | 97.7 /100 | #61 | Exceptional 11.3% |
| Immigrants | North America | 97.6 /100 | #62 | Exceptional 11.3% |
| Immigrants | Afghanistan | 97.5 /100 | #63 | Exceptional 11.3% |
Demographics Similar to Italians by Seniors Poverty Over the Age of 75
In terms of seniors poverty over the age of 75, the demographic groups most similar to Italians are Puget Sound Salish (10.8%, a difference of 0.050%), British (10.7%, a difference of 0.11%), Marshallese (10.7%, a difference of 0.25%), Luxembourger (10.8%, a difference of 0.38%), and Swiss (10.7%, a difference of 0.43%).
| Demographics | Rating | Rank | Seniors Poverty Over the Age of 75 |
| Northern Europeans | 99.8 /100 | #27 | Exceptional 10.7% |
| Irish | 99.8 /100 | #28 | Exceptional 10.7% |
| Assyrians/Chaldeans/Syriacs | 99.8 /100 | #29 | Exceptional 10.7% |
| Swiss | 99.7 /100 | #30 | Exceptional 10.7% |
| Marshallese | 99.7 /100 | #31 | Exceptional 10.7% |
| British | 99.7 /100 | #32 | Exceptional 10.7% |
| Puget Sound Salish | 99.7 /100 | #33 | Exceptional 10.8% |
| Italians | 99.7 /100 | #34 | Exceptional 10.8% |
| Luxembourgers | 99.6 /100 | #35 | Exceptional 10.8% |
| Scotch-Irish | 99.6 /100 | #36 | Exceptional 10.8% |
| Latvians | 99.6 /100 | #37 | Exceptional 10.8% |
| Finns | 99.6 /100 | #38 | Exceptional 10.8% |
| Czechoslovakians | 99.4 /100 | #39 | Exceptional 10.9% |
| Thais | 99.4 /100 | #40 | Exceptional 10.9% |
| Immigrants | Lithuania | 99.2 /100 | #41 | Exceptional 11.0% |