Venezuelan vs Italian Median Family Income
COMPARE
Venezuelan
Italian
Median Family Income
Median Family Income Comparison
Venezuelans
Italians
$96,281
MEDIAN FAMILY INCOME
3.7/ 100
METRIC RATING
223rd/ 347
METRIC RANK
$112,372
MEDIAN FAMILY INCOME
99.3/ 100
METRIC RATING
79th/ 347
METRIC RANK
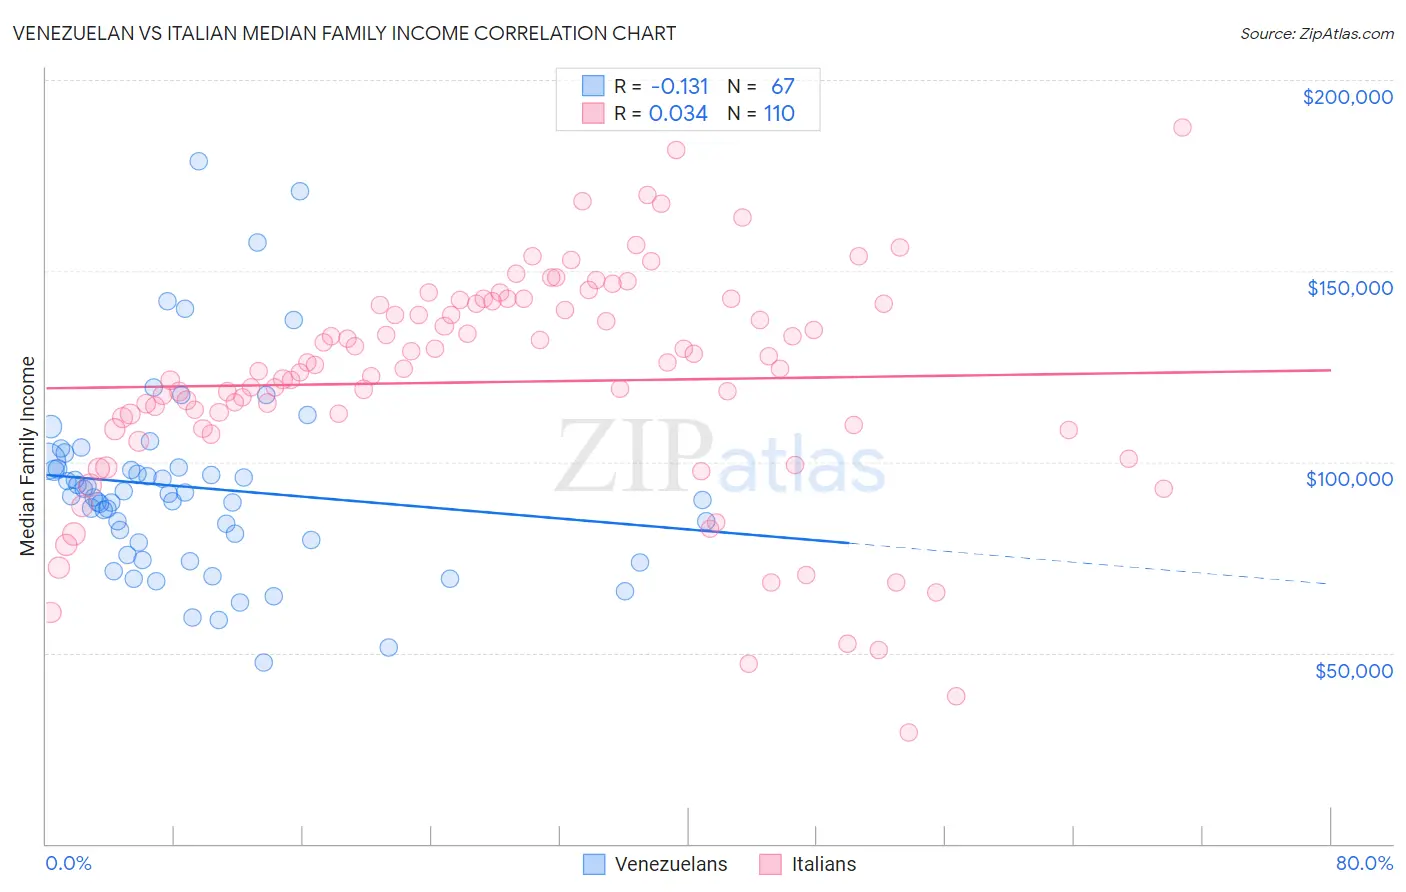
Venezuelan vs Italian Median Family Income Correlation Chart
The statistical analysis conducted on geographies consisting of 306,049,967 people shows a poor negative correlation between the proportion of Venezuelans and median family income in the United States with a correlation coefficient (R) of -0.131 and weighted average of $96,281. Similarly, the statistical analysis conducted on geographies consisting of 573,577,763 people shows no correlation between the proportion of Italians and median family income in the United States with a correlation coefficient (R) of 0.034 and weighted average of $112,372, a difference of 16.7%.
Median Family Income Correlation Summary
| Measurement | Venezuelan | Italian |
| Minimum | $47,465 | $29,018 |
| Maximum | $178,821 | $187,652 |
| Range | $131,356 | $158,634 |
| Mean | $93,300 | $120,937 |
| Median | $91,055 | $124,369 |
| Interquartile 25% (IQ1) | $78,904 | $108,740 |
| Interquartile 75% (IQ3) | $98,659 | $141,554 |
| Interquartile Range (IQR) | $19,755 | $32,814 |
| Standard Deviation (Sample) | $24,946 | $29,913 |
| Standard Deviation (Population) | $24,759 | $29,777 |
Similar Demographics by Median Family Income
Demographics Similar to Venezuelans by Median Family Income
In terms of median family income, the demographic groups most similar to Venezuelans are Nonimmigrants ($96,231, a difference of 0.050%), Immigrants from Nigeria ($96,439, a difference of 0.16%), Vietnamese ($96,123, a difference of 0.16%), Immigrants from Ghana ($96,544, a difference of 0.27%), and Sudanese ($96,783, a difference of 0.52%).
| Demographics | Rating | Rank | Median Family Income |
| Immigrants | Bosnia and Herzegovina | 6.4 /100 | #216 | Tragic $97,432 |
| Japanese | 6.0 /100 | #217 | Tragic $97,288 |
| Immigrants | Cambodia | 5.8 /100 | #218 | Tragic $97,222 |
| Delaware | 5.1 /100 | #219 | Tragic $96,958 |
| Sudanese | 4.7 /100 | #220 | Tragic $96,783 |
| Immigrants | Ghana | 4.2 /100 | #221 | Tragic $96,544 |
| Immigrants | Nigeria | 4.0 /100 | #222 | Tragic $96,439 |
| Venezuelans | 3.7 /100 | #223 | Tragic $96,281 |
| Immigrants | Nonimmigrants | 3.6 /100 | #224 | Tragic $96,231 |
| Vietnamese | 3.4 /100 | #225 | Tragic $96,123 |
| Immigrants | Panama | 2.7 /100 | #226 | Tragic $95,647 |
| Alaska Natives | 2.6 /100 | #227 | Tragic $95,573 |
| Immigrants | Azores | 2.4 /100 | #228 | Tragic $95,402 |
| Marshallese | 2.2 /100 | #229 | Tragic $95,293 |
| Malaysians | 2.2 /100 | #230 | Tragic $95,230 |
Demographics Similar to Italians by Median Family Income
In terms of median family income, the demographic groups most similar to Italians are Immigrants from Canada ($112,374, a difference of 0.0%), Immigrants from Croatia ($112,323, a difference of 0.040%), Immigrants from Eastern Europe ($112,527, a difference of 0.14%), Immigrants from North America ($112,151, a difference of 0.20%), and Argentinean ($112,665, a difference of 0.26%).
| Demographics | Rating | Rank | Median Family Income |
| Afghans | 99.5 /100 | #72 | Exceptional $112,971 |
| Laotians | 99.5 /100 | #73 | Exceptional $112,859 |
| Immigrants | Italy | 99.4 /100 | #74 | Exceptional $112,848 |
| Immigrants | Western Europe | 99.4 /100 | #75 | Exceptional $112,688 |
| Argentineans | 99.4 /100 | #76 | Exceptional $112,665 |
| Immigrants | Eastern Europe | 99.4 /100 | #77 | Exceptional $112,527 |
| Immigrants | Canada | 99.3 /100 | #78 | Exceptional $112,374 |
| Italians | 99.3 /100 | #79 | Exceptional $112,372 |
| Immigrants | Croatia | 99.3 /100 | #80 | Exceptional $112,323 |
| Immigrants | North America | 99.2 /100 | #81 | Exceptional $112,151 |
| Immigrants | England | 99.2 /100 | #82 | Exceptional $112,038 |
| Immigrants | Egypt | 99.0 /100 | #83 | Exceptional $111,689 |
| Immigrants | Hungary | 98.8 /100 | #84 | Exceptional $111,378 |
| Croatians | 98.8 /100 | #85 | Exceptional $111,370 |
| Ukrainians | 98.8 /100 | #86 | Exceptional $111,368 |