Maltese vs Immigrants from Hungary Median Earnings
COMPARE
Maltese
Immigrants from Hungary
Median Earnings
Median Earnings Comparison
Maltese
Immigrants from Hungary
$52,526
MEDIAN EARNINGS
100.0/ 100
METRIC RATING
42nd/ 347
METRIC RANK
$50,227
MEDIAN EARNINGS
99.5/ 100
METRIC RATING
84th/ 347
METRIC RANK
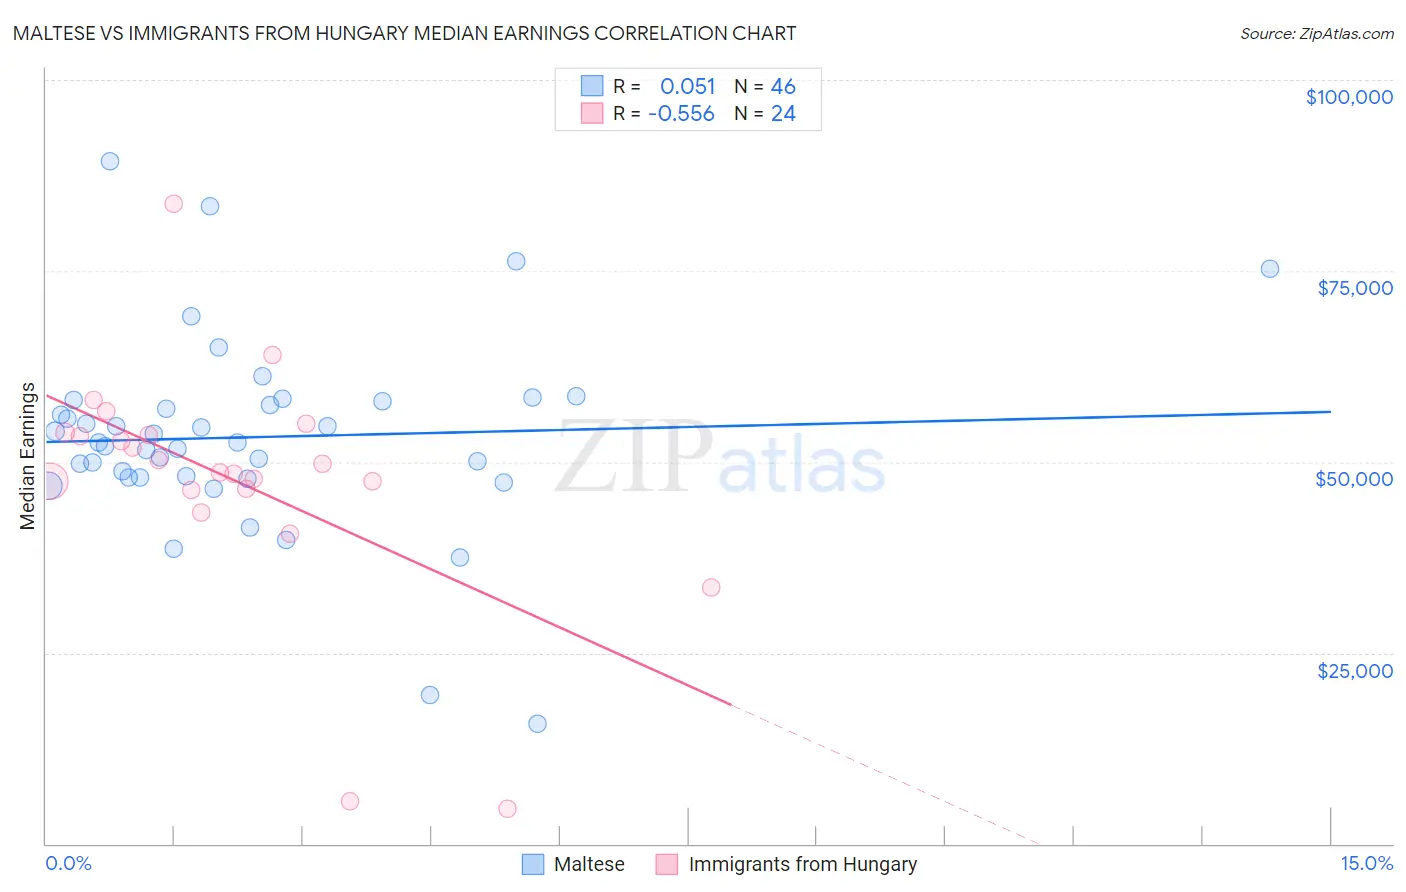
Maltese vs Immigrants from Hungary Median Earnings Correlation Chart
The statistical analysis conducted on geographies consisting of 126,475,400 people shows a slight positive correlation between the proportion of Maltese and median earnings in the United States with a correlation coefficient (R) of 0.051 and weighted average of $52,526. Similarly, the statistical analysis conducted on geographies consisting of 195,705,454 people shows a substantial negative correlation between the proportion of Immigrants from Hungary and median earnings in the United States with a correlation coefficient (R) of -0.556 and weighted average of $50,227, a difference of 4.6%.
Median Earnings Correlation Summary
| Measurement | Maltese | Immigrants from Hungary |
| Minimum | $15,781 | $4,622 |
| Maximum | $89,336 | $83,751 |
| Range | $73,555 | $79,129 |
| Mean | $53,240 | $47,628 |
| Median | $52,561 | $49,169 |
| Interquartile 25% (IQ1) | $48,020 | $46,381 |
| Interquartile 75% (IQ3) | $57,908 | $53,646 |
| Interquartile Range (IQR) | $9,888 | $7,266 |
| Standard Deviation (Sample) | $12,910 | $15,967 |
| Standard Deviation (Population) | $12,769 | $15,631 |
Similar Demographics by Median Earnings
Demographics Similar to Maltese by Median Earnings
In terms of median earnings, the demographic groups most similar to Maltese are Immigrants from Malaysia ($52,514, a difference of 0.020%), Bulgarian ($52,512, a difference of 0.030%), Immigrants from Czechoslovakia ($52,361, a difference of 0.31%), Bhutanese ($52,297, a difference of 0.44%), and Australian ($52,294, a difference of 0.44%).
| Demographics | Rating | Rank | Median Earnings |
| Immigrants | Switzerland | 100.0 /100 | #35 | Exceptional $53,211 |
| Immigrants | Denmark | 100.0 /100 | #36 | Exceptional $53,186 |
| Immigrants | Belarus | 100.0 /100 | #37 | Exceptional $53,043 |
| Latvians | 100.0 /100 | #38 | Exceptional $53,001 |
| Immigrants | Turkey | 100.0 /100 | #39 | Exceptional $52,960 |
| Israelis | 100.0 /100 | #40 | Exceptional $52,937 |
| Immigrants | Lithuania | 100.0 /100 | #41 | Exceptional $52,769 |
| Maltese | 100.0 /100 | #42 | Exceptional $52,526 |
| Immigrants | Malaysia | 100.0 /100 | #43 | Exceptional $52,514 |
| Bulgarians | 100.0 /100 | #44 | Exceptional $52,512 |
| Immigrants | Czechoslovakia | 100.0 /100 | #45 | Exceptional $52,361 |
| Bhutanese | 100.0 /100 | #46 | Exceptional $52,297 |
| Australians | 100.0 /100 | #47 | Exceptional $52,294 |
| Immigrants | Europe | 100.0 /100 | #48 | Exceptional $52,195 |
| Bolivians | 100.0 /100 | #49 | Exceptional $52,005 |
Demographics Similar to Immigrants from Hungary by Median Earnings
In terms of median earnings, the demographic groups most similar to Immigrants from Hungary are Immigrants from Kazakhstan ($50,225, a difference of 0.0%), Romanian ($50,244, a difference of 0.030%), Immigrants from Canada ($50,192, a difference of 0.070%), Immigrants from Moldova ($50,274, a difference of 0.090%), and Immigrants from Southern Europe ($50,280, a difference of 0.11%).
| Demographics | Rating | Rank | Median Earnings |
| Immigrants | Western Europe | 99.7 /100 | #77 | Exceptional $50,549 |
| Argentineans | 99.6 /100 | #78 | Exceptional $50,399 |
| Laotians | 99.6 /100 | #79 | Exceptional $50,343 |
| Ukrainians | 99.6 /100 | #80 | Exceptional $50,320 |
| Immigrants | Southern Europe | 99.6 /100 | #81 | Exceptional $50,280 |
| Immigrants | Moldova | 99.5 /100 | #82 | Exceptional $50,274 |
| Romanians | 99.5 /100 | #83 | Exceptional $50,244 |
| Immigrants | Hungary | 99.5 /100 | #84 | Exceptional $50,227 |
| Immigrants | Kazakhstan | 99.5 /100 | #85 | Exceptional $50,225 |
| Immigrants | Canada | 99.5 /100 | #86 | Exceptional $50,192 |
| Immigrants | Uzbekistan | 99.5 /100 | #87 | Exceptional $50,151 |
| Albanians | 99.4 /100 | #88 | Exceptional $50,116 |
| Immigrants | North America | 99.4 /100 | #89 | Exceptional $50,108 |
| Italians | 99.3 /100 | #90 | Exceptional $49,915 |
| Macedonians | 99.2 /100 | #91 | Exceptional $49,893 |