English vs Immigrants from Hungary Median Earnings

COMPARE

English
Race
Ancestry
AfghanAfricanAlaska NativeAlaskan AthabascanAlbanianAleutAlsatianAmericanApacheArabArapahoArgentineanArmenianAssyrian/Chaldean/SyriacAustralianAustrianBahamianBangladeshiBarbadianBasqueBelgianBelizeanBermudanBhutaneseBlackfeetBolivianBrazilianBritishBritish West IndianBulgarianBurmeseCajunCambodianCanadianCape VerdeanCarpatho RusynCelticCentral AmericanCentral American IndianCherokeeCheyenneChickasawChileanChineseChippewaChoctawColombianColvilleComancheCosta RicanCreeCreekCroatianCrowCubanCypriotCzechCzechoslovakianDanishDelawareDominicanDutchDutch West IndianEastern EuropeanEcuadorianEgyptianEnglishEstonianEthiopianEuropeanFijianFilipinoFinnishFrenchFrench American IndianFrench CanadianGermanGerman RussianGhanaianGreekGuamanian/ChamorroGuatemalanGuyaneseHaitianHmongHonduranHopiHoumaHungarianIcelanderIndian (Asian)IndonesianInupiatIranianIraqiIrishIroquoisIsraeliItalianJamaicanJapaneseJordanianKenyanKiowaKoreanLaotianLatvianLebaneseLiberianLithuanianLumbeeLuxembourgerMacedonianMalaysianMalteseMarshalleseMenomineeMexicanMexican American IndianMongolianMoroccanNative HawaiianNavajoNepaleseNew ZealanderNicaraguanNigerianNorthern EuropeanNorwegianOkinawanOsageOttawaPaiutePakistaniPalestinianPanamanianParaguayanPennsylvania GermanPeruvianPimaPolishPortuguesePotawatomiPuebloPuerto RicanPuget Sound SalishRomanianRussianSalvadoranSamoanScandinavianScotch-IrishScottishSeminoleSenegaleseSerbianShoshoneSierra LeoneanSiouxSlavicSlovakSloveneSomaliSouth AfricanSouth AmericanSouth American IndianSoviet UnionSpaniardSpanishSpanish AmericanSpanish American IndianSri LankanSubsaharan AfricanSudaneseSwedishSwissSyrianTaiwaneseThaiTlingit-HaidaTohono O'OdhamTonganTrinidadian and TobagonianTsimshianTurkishU.S. Virgin IslanderUgandanUkrainianUruguayanUteVenezuelanVietnameseWelshWest IndianYakamaYaquiYugoslavianYumanYup'ikZimbabwean
Immigration
NonimmigrantsImmigrantsAfghanistanAfricaAlbaniaArgentinaArmeniaAsiaAustraliaAustriaBahamasBangladeshBarbadosBelarusBelgiumBelizeBoliviaBosnia and HerzegovinaBrazilBulgariaBurma/MyanmarCabo VerdeCambodiaCameroonCanadaCaribbeanCentral AmericaChileChinaColombiaCongoCosta RicaCroatiaCubaCzechoslovakiaDenmarkDominicaDominican RepublicEastern AfricaEastern AsiaEastern EuropeEcuadorEgyptEl SalvadorEnglandEritreaEthiopiaEuropeFijiFranceGermanyGhanaGreeceGrenadaGuatemalaGuyanaHaitiHondurasHong KongIndiaIndonesiaIranIraqIrelandIsraelItalyJamaicaJapanJordanKazakhstanKenyaKoreaKuwaitLaosLatin AmericaLatviaLebanonLiberiaLithuaniaMalaysiaMexicoMicronesiaMiddle AfricaMoldovaMoroccoNepalNetherlandsNicaraguaNigeriaNorth AmericaNorth MacedoniaNorthern AfricaNorthern EuropeNorwayOceaniaPakistanPanamaPeruPhilippinesPolandPortugalRomaniaRussiaSaudi ArabiaScotlandSenegalSerbiaSierra LeoneSingaporeSomaliaSouth AfricaSouth AmericaSouth Central AsiaSouth Eastern AsiaSouthern EuropeSpainSri LankaSt. Vincent and the GrenadinesSudanSwedenSwitzerlandSyriaTaiwanThailandTrinidad and TobagoTurkeyUgandaUkraineUruguayUzbekistanVenezuelaVietnamWest IndiesWestern AfricaWestern AsiaWestern EuropeYemenZaireZimbabweAzores
Immigrants from Hungary
Race
Ancestry
AfghanAfricanAlaska NativeAlaskan AthabascanAlbanianAleutAlsatianAmericanApacheArabArapahoArgentineanArmenianAssyrian/Chaldean/SyriacAustralianAustrianBahamianBangladeshiBarbadianBasqueBelgianBelizeanBermudanBhutaneseBlackfeetBolivianBrazilianBritishBritish West IndianBulgarianBurmeseCajunCambodianCanadianCape VerdeanCarpatho RusynCelticCentral AmericanCentral American IndianCherokeeCheyenneChickasawChileanChineseChippewaChoctawColombianColvilleComancheCosta RicanCreeCreekCroatianCrowCubanCypriotCzechCzechoslovakianDanishDelawareDominicanDutchDutch West IndianEastern EuropeanEcuadorianEgyptianEstonianEthiopianEuropeanFijianFilipinoFinnishFrenchFrench American IndianFrench CanadianGermanGerman RussianGhanaianGreekGuamanian/ChamorroGuatemalanGuyaneseHaitianHmongHonduranHopiHoumaHungarianIcelanderIndian (Asian)IndonesianInupiatIranianIraqiIrishIroquoisIsraeliItalianJamaicanJapaneseJordanianKenyanKiowaKoreanLaotianLatvianLebaneseLiberianLithuanianLumbeeLuxembourgerMacedonianMalaysianMalteseMarshalleseMenomineeMexicanMexican American IndianMongolianMoroccanNative HawaiianNavajoNepaleseNew ZealanderNicaraguanNigerianNorthern EuropeanNorwegianOkinawanOsageOttawaPaiutePakistaniPalestinianPanamanianParaguayanPennsylvania GermanPeruvianPimaPolishPortuguesePotawatomiPuebloPuerto RicanPuget Sound SalishRomanianRussianSalvadoranSamoanScandinavianScotch-IrishScottishSeminoleSenegaleseSerbianShoshoneSierra LeoneanSiouxSlavicSlovakSloveneSomaliSouth AfricanSouth AmericanSouth American IndianSoviet UnionSpaniardSpanishSpanish AmericanSpanish American IndianSri LankanSubsaharan AfricanSudaneseSwedishSwissSyrianTaiwaneseThaiTlingit-HaidaTohono O'OdhamTonganTrinidadian and TobagonianTsimshianTurkishU.S. Virgin IslanderUgandanUkrainianUruguayanUteVenezuelanVietnameseWelshWest IndianYakamaYaquiYugoslavianYumanYup'ikZimbabwean
Immigration
NonimmigrantsImmigrantsAfghanistanAfricaAlbaniaArgentinaArmeniaAsiaAustraliaAustriaBahamasBangladeshBarbadosBelarusBelgiumBelizeBoliviaBosnia and HerzegovinaBrazilBulgariaBurma/MyanmarCabo VerdeCambodiaCameroonCanadaCaribbeanCentral AmericaChileChinaColombiaCongoCosta RicaCroatiaCubaCzechoslovakiaDenmarkDominicaDominican RepublicEastern AfricaEastern AsiaEastern EuropeEcuadorEgyptEl SalvadorEnglandEritreaEthiopiaEuropeFijiFranceGermanyGhanaGreeceGrenadaGuatemalaGuyanaHaitiHondurasHong KongHungaryIndiaIndonesiaIranIraqIrelandIsraelItalyJamaicaJapanJordanKazakhstanKenyaKoreaKuwaitLaosLatin AmericaLatviaLebanonLiberiaLithuaniaMalaysiaMexicoMicronesiaMiddle AfricaMoldovaMoroccoNepalNetherlandsNicaraguaNigeriaNorth AmericaNorth MacedoniaNorthern AfricaNorthern EuropeNorwayOceaniaPakistanPanamaPeruPhilippinesPolandPortugalRomaniaRussiaSaudi ArabiaScotlandSenegalSerbiaSierra LeoneSingaporeSomaliaSouth AfricaSouth AmericaSouth Central AsiaSouth Eastern AsiaSouthern EuropeSpainSri LankaSt. Vincent and the GrenadinesSudanSwedenSwitzerlandSyriaTaiwanThailandTrinidad and TobagoTurkeyUgandaUkraineUruguayUzbekistanVenezuelaVietnamWest IndiesWestern AfricaWestern AsiaWestern EuropeYemenZaireZimbabweAzores
Median Earnings
Income
Poverty
Unemployment
Labor Participation
Family Structure
Vehicle Availability
Education Level
Disability

Median Earnings Comparison

English

Immigrants from Hungary

Average
Exceptional
$46,334
MEDIAN EARNINGS
46.5/ 100
METRIC RATING
179th/ 347
METRIC RANK
$50,227
MEDIAN EARNINGS
99.5/ 100
METRIC RATING
84th/ 347
METRIC RANK

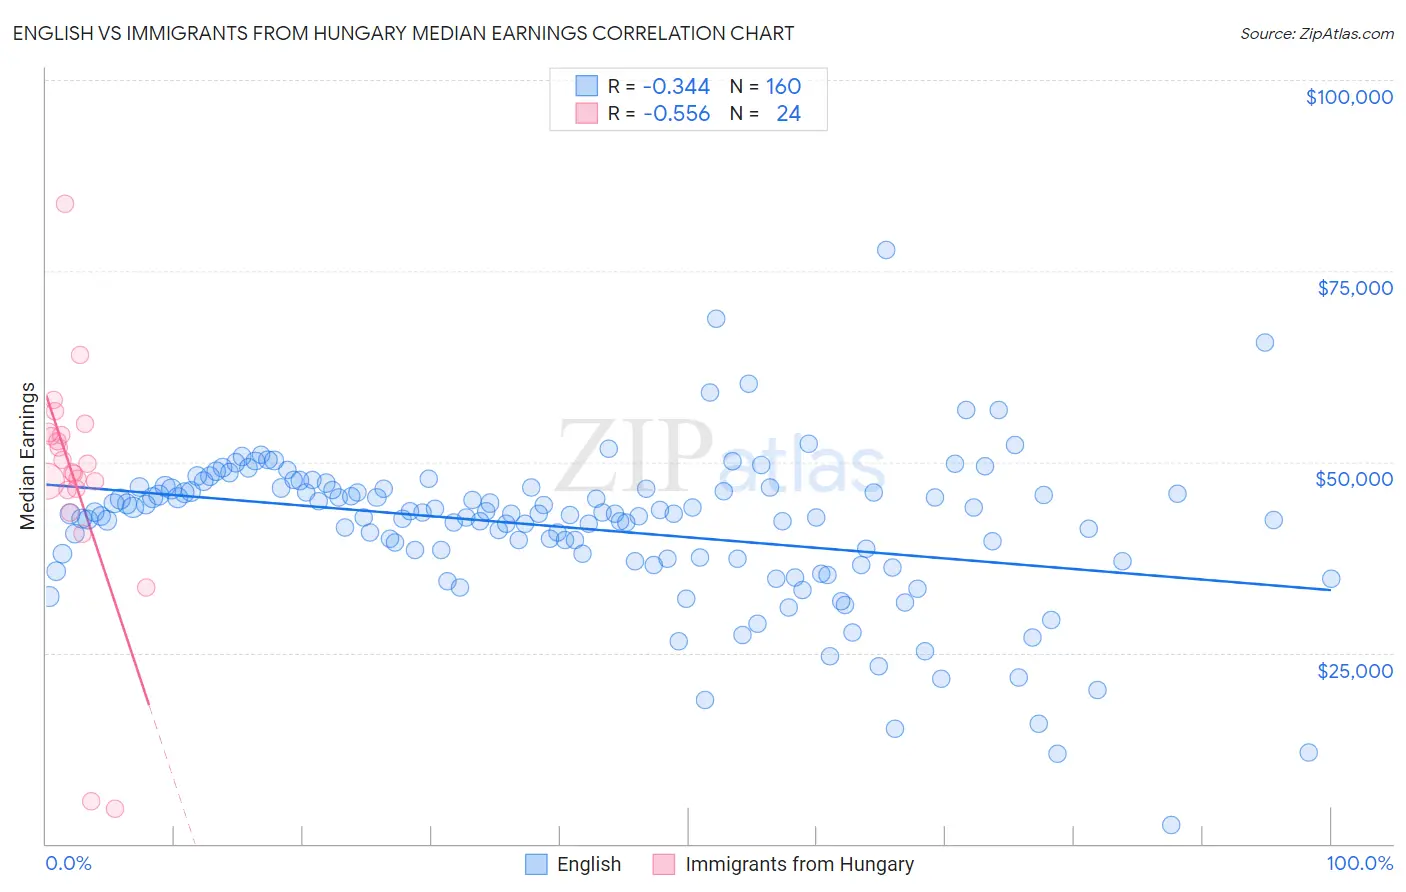
English vs Immigrants from Hungary Median Earnings Correlation Chart

The statistical analysis conducted on geographies consisting of 579,205,979 people shows a mild negative correlation between the proportion of English and median earnings in the United States with a correlation coefficient (R) of -0.344 and weighted average of $46,334. Similarly, the statistical analysis conducted on geographies consisting of 195,705,454 people shows a substantial negative correlation between the proportion of Immigrants from Hungary and median earnings in the United States with a correlation coefficient (R) of -0.556 and weighted average of $50,227, a difference of 8.4%.
English vs Immigrants from Hungary Median Earnings

Median Earnings Correlation Summary

MeasurementEnglishImmigrants from Hungary
Minimum$2,499$4,622
Maximum$77,673$83,751
Range$75,174$79,129
Mean$41,372$47,628
Median$43,164$49,169
Interquartile 25% (IQ1)$37,358$46,381
Interquartile 75% (IQ3)$46,458$53,646
Interquartile Range (IQR)$9,099$7,266
Standard Deviation (Sample)$9,981$15,967
Standard Deviation (Population)$9,950$15,631

Similar Demographics by Median Earnings

Demographics Similar to English by Median Earnings

In terms of median earnings, the demographic groups most similar to English are Puget Sound Salish ($46,333, a difference of 0.0%), Immigrants from Cameroon ($46,329, a difference of 0.010%), Colombian ($46,349, a difference of 0.030%), Swiss ($46,315, a difference of 0.040%), and French ($46,296, a difference of 0.080%).
DemographicsRating | RankMedian Earnings
Kenyans
51.0
/100
|
#172
Average
$46,462
Ghanaians
50.3
/100
|
#173
Average
$46,440
Scandinavians
50.0
/100
|
#174
Average
$46,433
Basques
48.8
/100
|
#175
Average
$46,399
Danes
48.6
/100
|
#176
Average
$46,392
Belgians
48.0
/100
|
#177
Average
$46,375
Colombians
47.1
/100
|
#178
Average
$46,349
English
46.5
/100
|
#179
Average
$46,334
Puget Sound Salish
46.5
/100
|
#180
Average
$46,333
Immigrants | Cameroon
46.4
/100
|
#181
Average
$46,329
Swiss
45.9
/100
|
#182
Average
$46,315
French
45.2
/100
|
#183
Average
$46,296
Immigrants | Kenya
42.4
/100
|
#184
Average
$46,214
Uruguayans
41.6
/100
|
#185
Average
$46,190
Vietnamese
40.9
/100
|
#186
Average
$46,172

Demographics Similar to Immigrants from Hungary by Median Earnings

In terms of median earnings, the demographic groups most similar to Immigrants from Hungary are Immigrants from Kazakhstan ($50,225, a difference of 0.0%), Romanian ($50,244, a difference of 0.030%), Immigrants from Canada ($50,192, a difference of 0.070%), Immigrants from Moldova ($50,274, a difference of 0.090%), and Immigrants from Southern Europe ($50,280, a difference of 0.11%).
DemographicsRating | RankMedian Earnings
Immigrants | Western Europe
99.7
/100
|
#77
Exceptional
$50,549
Argentineans
99.6
/100
|
#78
Exceptional
$50,399
Laotians
99.6
/100
|
#79
Exceptional
$50,343
Ukrainians
99.6
/100
|
#80
Exceptional
$50,320
Immigrants | Southern Europe
99.6
/100
|
#81
Exceptional
$50,280
Immigrants | Moldova
99.5
/100
|
#82
Exceptional
$50,274
Romanians
99.5
/100
|
#83
Exceptional
$50,244
Immigrants | Hungary
99.5
/100
|
#84
Exceptional
$50,227
Immigrants | Kazakhstan
99.5
/100
|
#85
Exceptional
$50,225
Immigrants | Canada
99.5
/100
|
#86
Exceptional
$50,192
Immigrants | Uzbekistan
99.5
/100
|
#87
Exceptional
$50,151
Albanians
99.4
/100
|
#88
Exceptional
$50,116
Immigrants | North America
99.4
/100
|
#89
Exceptional
$50,108
Italians
99.3
/100
|
#90
Exceptional
$49,915
Macedonians
99.2
/100
|
#91
Exceptional
$49,893