Slavic vs Immigrants from Africa Householder Income Under 25 years
COMPARE
Slavic
Immigrants from Africa
Householder Income Under 25 years
Householder Income Under 25 years Comparison
Slavs
Immigrants from Africa
$50,563
HOUSEHOLDER INCOME UNDER 25 YEARS
1.8/ 100
METRIC RATING
248th/ 347
METRIC RANK
$50,609
HOUSEHOLDER INCOME UNDER 25 YEARS
2.0/ 100
METRIC RATING
245th/ 347
METRIC RANK
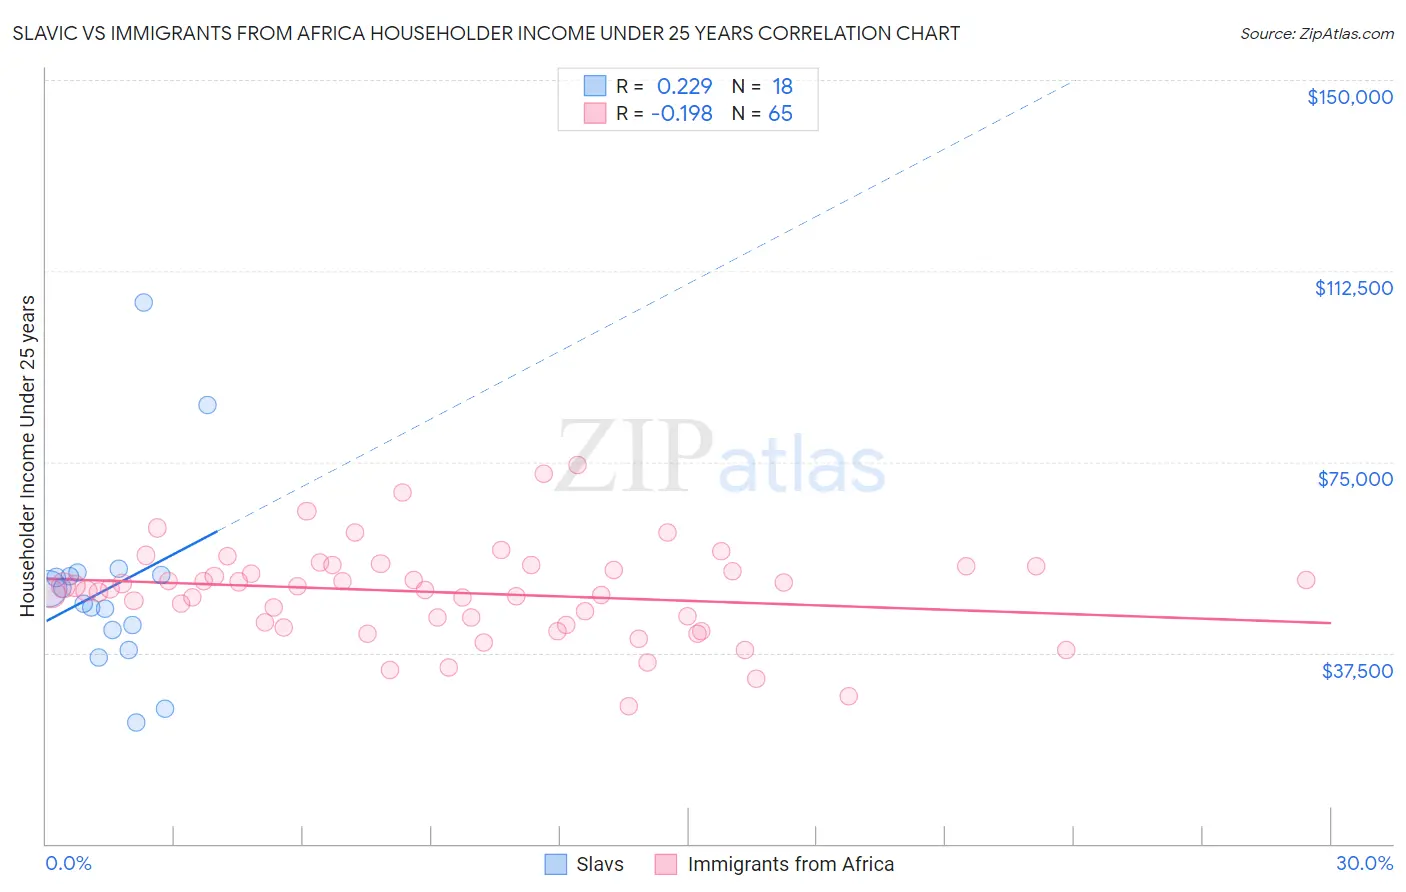
Slavic vs Immigrants from Africa Householder Income Under 25 years Correlation Chart
The statistical analysis conducted on geographies consisting of 235,100,045 people shows a weak positive correlation between the proportion of Slavs and household income with householder under the age of 25 in the United States with a correlation coefficient (R) of 0.229 and weighted average of $50,563. Similarly, the statistical analysis conducted on geographies consisting of 387,551,997 people shows a poor negative correlation between the proportion of Immigrants from Africa and household income with householder under the age of 25 in the United States with a correlation coefficient (R) of -0.198 and weighted average of $50,609, a difference of 0.090%.
Householder Income Under 25 years Correlation Summary
| Measurement | Slavic | Immigrants from Africa |
| Minimum | $23,750 | $26,950 |
| Maximum | $106,250 | $74,456 |
| Range | $82,500 | $47,507 |
| Mean | $50,421 | $49,315 |
| Median | $48,652 | $49,967 |
| Interquartile 25% (IQ1) | $41,986 | $43,274 |
| Interquartile 75% (IQ3) | $52,857 | $54,425 |
| Interquartile Range (IQR) | $10,871 | $11,151 |
| Standard Deviation (Sample) | $19,147 | $9,288 |
| Standard Deviation (Population) | $18,607 | $9,217 |
Demographics Similar to Slavs and Immigrants from Africa by Householder Income Under 25 years
In terms of householder income under 25 years, the demographic groups most similar to Slavs are Immigrants from Bosnia and Herzegovina ($50,565, a difference of 0.0%), Scottish ($50,554, a difference of 0.020%), Welsh ($50,597, a difference of 0.070%), Immigrants from Cabo Verde ($50,520, a difference of 0.090%), and Marshallese ($50,627, a difference of 0.13%). Similarly, the demographic groups most similar to Immigrants from Africa are Welsh ($50,597, a difference of 0.020%), Marshallese ($50,627, a difference of 0.040%), Immigrants from Thailand ($50,645, a difference of 0.070%), Cuban ($50,655, a difference of 0.090%), and Immigrants from Bosnia and Herzegovina ($50,565, a difference of 0.090%).
| Demographics | Rating | Rank | Householder Income Under 25 years |
| English | 3.3 /100 | #236 | Tragic $50,805 |
| Germans | 3.3 /100 | #237 | Tragic $50,804 |
| Iraqis | 3.2 /100 | #238 | Tragic $50,802 |
| Immigrants | Caribbean | 2.9 /100 | #239 | Tragic $50,757 |
| Immigrants | Lebanon | 2.7 /100 | #240 | Tragic $50,729 |
| Immigrants | Micronesia | 2.5 /100 | #241 | Tragic $50,691 |
| Cubans | 2.3 /100 | #242 | Tragic $50,655 |
| Immigrants | Thailand | 2.2 /100 | #243 | Tragic $50,645 |
| Marshallese | 2.1 /100 | #244 | Tragic $50,627 |
| Immigrants | Africa | 2.0 /100 | #245 | Tragic $50,609 |
| Welsh | 2.0 /100 | #246 | Tragic $50,597 |
| Immigrants | Bosnia and Herzegovina | 1.8 /100 | #247 | Tragic $50,565 |
| Slavs | 1.8 /100 | #248 | Tragic $50,563 |
| Scottish | 1.8 /100 | #249 | Tragic $50,554 |
| Immigrants | Cabo Verde | 1.7 /100 | #250 | Tragic $50,520 |
| Celtics | 1.4 /100 | #251 | Tragic $50,447 |
| Immigrants | Mexico | 1.3 /100 | #252 | Tragic $50,422 |
| Immigrants | Haiti | 1.2 /100 | #253 | Tragic $50,398 |
| Luxembourgers | 1.2 /100 | #254 | Tragic $50,379 |
| Aleuts | 1.2 /100 | #255 | Tragic $50,377 |
| Immigrants | Cuba | 1.2 /100 | #256 | Tragic $50,374 |