Sioux vs Immigrants from Norway Disability Age 65 to 74
COMPARE
Sioux
Immigrants from Norway
Disability Age 65 to 74
Disability Age 65 to 74 Comparison
Sioux
Immigrants from Norway
27.3%
DISABILITY AGE 65 TO 74
0.0/ 100
METRIC RATING
308th/ 347
METRIC RANK
21.8%
DISABILITY AGE 65 TO 74
98.9/ 100
METRIC RATING
80th/ 347
METRIC RANK
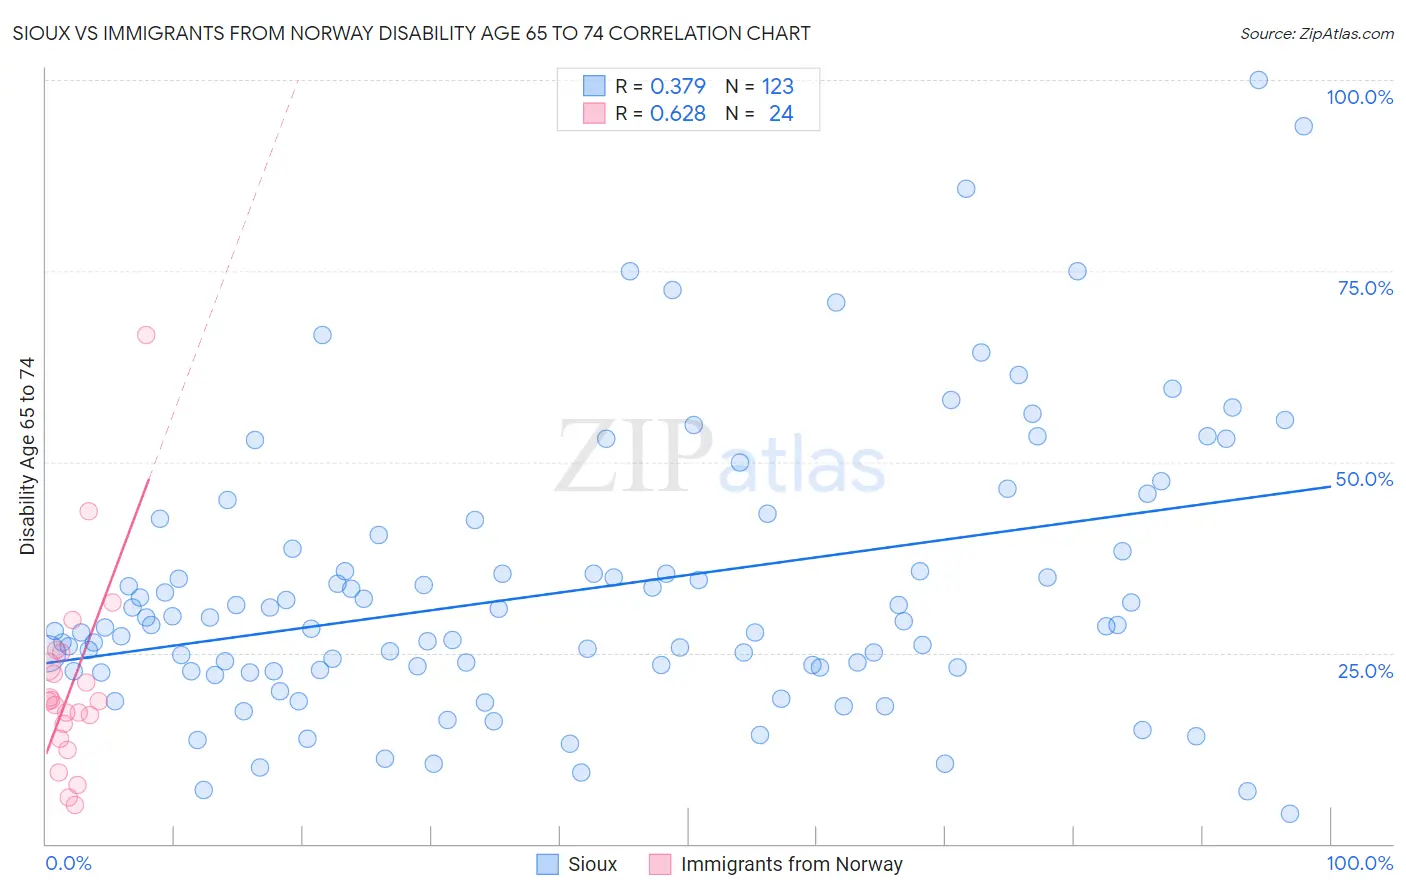
Sioux vs Immigrants from Norway Disability Age 65 to 74 Correlation Chart
The statistical analysis conducted on geographies consisting of 233,824,340 people shows a mild positive correlation between the proportion of Sioux and percentage of population with a disability between the ages 65 and 75 in the United States with a correlation coefficient (R) of 0.379 and weighted average of 27.3%. Similarly, the statistical analysis conducted on geographies consisting of 116,625,625 people shows a significant positive correlation between the proportion of Immigrants from Norway and percentage of population with a disability between the ages 65 and 75 in the United States with a correlation coefficient (R) of 0.628 and weighted average of 21.8%, a difference of 25.5%.
Disability Age 65 to 74 Correlation Summary
| Measurement | Sioux | Immigrants from Norway |
| Minimum | 4.0% | 5.0% |
| Maximum | 100.0% | 66.7% |
| Range | 96.0% | 61.6% |
| Mean | 33.2% | 20.9% |
| Median | 28.6% | 18.7% |
| Interquartile 25% (IQ1) | 22.8% | 14.7% |
| Interquartile 75% (IQ3) | 38.6% | 24.1% |
| Interquartile Range (IQR) | 15.9% | 9.4% |
| Standard Deviation (Sample) | 17.9% | 12.9% |
| Standard Deviation (Population) | 17.8% | 12.6% |
Similar Demographics by Disability Age 65 to 74
Demographics Similar to Sioux by Disability Age 65 to 74
In terms of disability age 65 to 74, the demographic groups most similar to Sioux are Yaqui (27.4%, a difference of 0.060%), Shoshone (27.4%, a difference of 0.11%), Ute (27.3%, a difference of 0.15%), Black/African American (27.3%, a difference of 0.21%), and Menominee (27.4%, a difference of 0.34%).
| Demographics | Rating | Rank | Disability Age 65 to 74 |
| Immigrants | Mexico | 0.0 /100 | #301 | Tragic 27.1% |
| Central American Indians | 0.0 /100 | #302 | Tragic 27.1% |
| Tlingit-Haida | 0.0 /100 | #303 | Tragic 27.1% |
| Puget Sound Salish | 0.0 /100 | #304 | Tragic 27.2% |
| Mexicans | 0.0 /100 | #305 | Tragic 27.2% |
| Blacks/African Americans | 0.0 /100 | #306 | Tragic 27.3% |
| Ute | 0.0 /100 | #307 | Tragic 27.3% |
| Sioux | 0.0 /100 | #308 | Tragic 27.3% |
| Yaqui | 0.0 /100 | #309 | Tragic 27.4% |
| Shoshone | 0.0 /100 | #310 | Tragic 27.4% |
| Menominee | 0.0 /100 | #311 | Tragic 27.4% |
| Osage | 0.0 /100 | #312 | Tragic 27.5% |
| Paiute | 0.0 /100 | #313 | Tragic 27.8% |
| Chippewa | 0.0 /100 | #314 | Tragic 27.8% |
| Cajuns | 0.0 /100 | #315 | Tragic 27.9% |
Demographics Similar to Immigrants from Norway by Disability Age 65 to 74
In terms of disability age 65 to 74, the demographic groups most similar to Immigrants from Norway are Venezuelan (21.8%, a difference of 0.010%), Immigrants from Eastern Europe (21.8%, a difference of 0.020%), Immigrants from Poland (21.8%, a difference of 0.070%), Croatian (21.8%, a difference of 0.070%), and Greek (21.8%, a difference of 0.13%).
| Demographics | Rating | Rank | Disability Age 65 to 74 |
| Immigrants | Venezuela | 99.0 /100 | #73 | Exceptional 21.8% |
| Cambodians | 99.0 /100 | #74 | Exceptional 21.8% |
| Mongolians | 99.0 /100 | #75 | Exceptional 21.8% |
| Greeks | 99.0 /100 | #76 | Exceptional 21.8% |
| Immigrants | Poland | 99.0 /100 | #77 | Exceptional 21.8% |
| Immigrants | Eastern Europe | 99.0 /100 | #78 | Exceptional 21.8% |
| Venezuelans | 99.0 /100 | #79 | Exceptional 21.8% |
| Immigrants | Norway | 98.9 /100 | #80 | Exceptional 21.8% |
| Croatians | 98.9 /100 | #81 | Exceptional 21.8% |
| Immigrants | Indonesia | 98.7 /100 | #82 | Exceptional 21.9% |
| Immigrants | Brazil | 98.5 /100 | #83 | Exceptional 21.9% |
| Immigrants | Spain | 98.5 /100 | #84 | Exceptional 21.9% |
| Immigrants | Lebanon | 98.4 /100 | #85 | Exceptional 21.9% |
| South Africans | 98.4 /100 | #86 | Exceptional 21.9% |
| Australians | 98.0 /100 | #87 | Exceptional 22.0% |