Colville vs Immigrants from Norway Median Earnings
COMPARE
Colville
Immigrants from Norway
Median Earnings
Median Earnings Comparison
Colville
Immigrants from Norway
$42,151
MEDIAN EARNINGS
0.2/ 100
METRIC RATING
279th/ 347
METRIC RANK
$51,758
MEDIAN EARNINGS
99.9/ 100
METRIC RATING
53rd/ 347
METRIC RANK
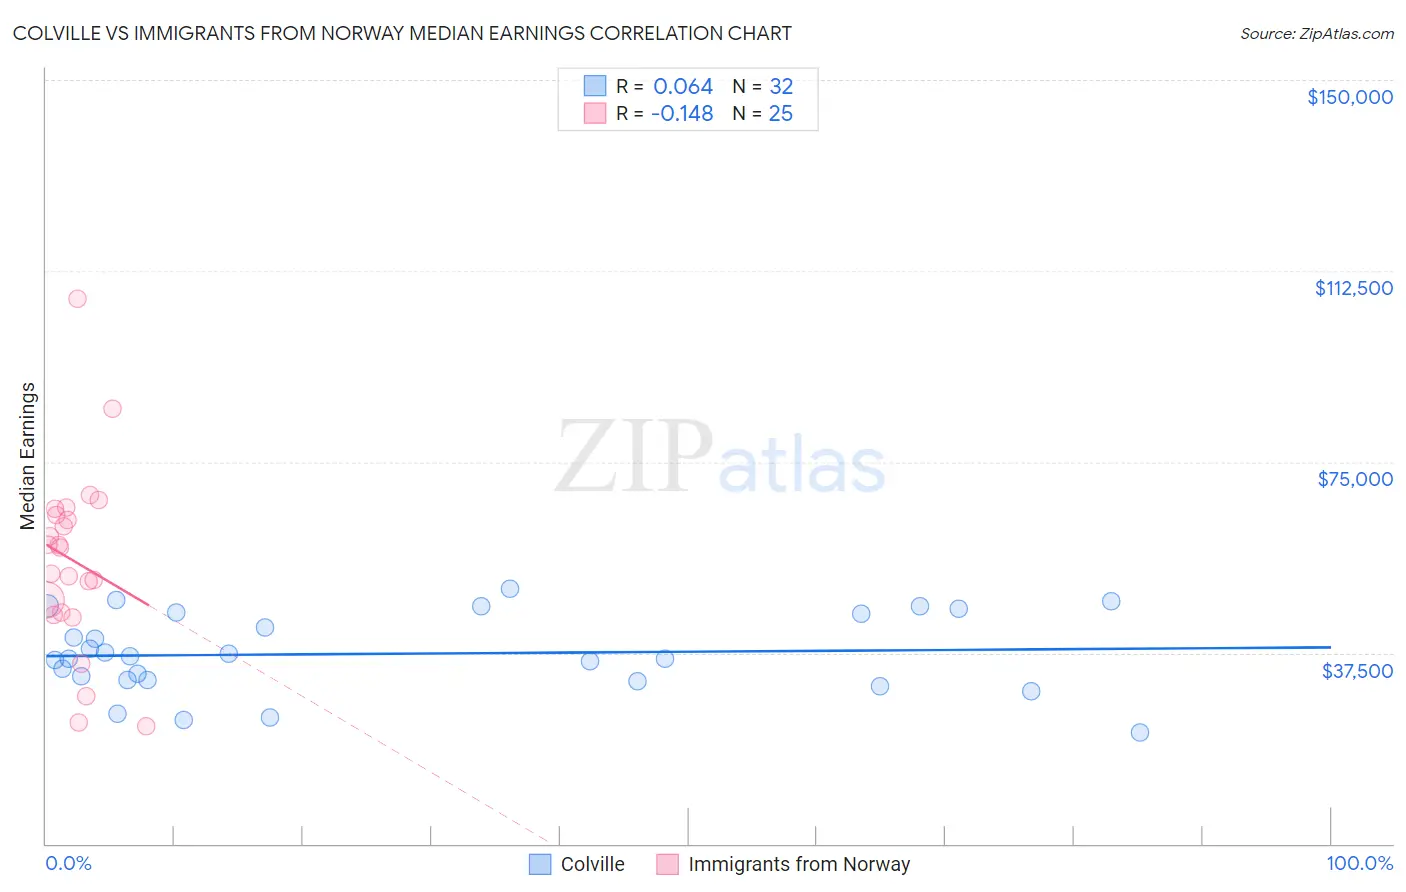
Colville vs Immigrants from Norway Median Earnings Correlation Chart
The statistical analysis conducted on geographies consisting of 34,684,676 people shows a slight positive correlation between the proportion of Colville and median earnings in the United States with a correlation coefficient (R) of 0.064 and weighted average of $42,151. Similarly, the statistical analysis conducted on geographies consisting of 116,707,889 people shows a poor negative correlation between the proportion of Immigrants from Norway and median earnings in the United States with a correlation coefficient (R) of -0.148 and weighted average of $51,758, a difference of 22.8%.
Median Earnings Correlation Summary
| Measurement | Colville | Immigrants from Norway |
| Minimum | $21,944 | $23,125 |
| Maximum | $50,045 | $106,979 |
| Range | $28,101 | $83,854 |
| Mean | $37,312 | $55,577 |
| Median | $36,531 | $58,159 |
| Interquartile 25% (IQ1) | $32,193 | $45,162 |
| Interquartile 75% (IQ3) | $45,323 | $65,163 |
| Interquartile Range (IQR) | $13,130 | $20,000 |
| Standard Deviation (Sample) | $7,666 | $18,163 |
| Standard Deviation (Population) | $7,545 | $17,796 |
Similar Demographics by Median Earnings
Demographics Similar to Colville by Median Earnings
In terms of median earnings, the demographic groups most similar to Colville are Cajun ($42,189, a difference of 0.090%), Hmong ($42,111, a difference of 0.10%), Central American ($42,280, a difference of 0.31%), Spanish American ($42,316, a difference of 0.39%), and Marshallese ($41,969, a difference of 0.43%).
| Demographics | Rating | Rank | Median Earnings |
| Iroquois | 0.4 /100 | #272 | Tragic $42,430 |
| Immigrants | Dominica | 0.4 /100 | #273 | Tragic $42,420 |
| Immigrants | El Salvador | 0.4 /100 | #274 | Tragic $42,413 |
| Immigrants | Belize | 0.3 /100 | #275 | Tragic $42,339 |
| Spanish Americans | 0.3 /100 | #276 | Tragic $42,316 |
| Central Americans | 0.3 /100 | #277 | Tragic $42,280 |
| Cajuns | 0.3 /100 | #278 | Tragic $42,189 |
| Colville | 0.2 /100 | #279 | Tragic $42,151 |
| Hmong | 0.2 /100 | #280 | Tragic $42,111 |
| Marshallese | 0.2 /100 | #281 | Tragic $41,969 |
| Africans | 0.2 /100 | #282 | Tragic $41,955 |
| Dominicans | 0.2 /100 | #283 | Tragic $41,864 |
| Blackfeet | 0.2 /100 | #284 | Tragic $41,822 |
| Immigrants | Nicaragua | 0.1 /100 | #285 | Tragic $41,737 |
| Mexican American Indians | 0.1 /100 | #286 | Tragic $41,719 |
Demographics Similar to Immigrants from Norway by Median Earnings
In terms of median earnings, the demographic groups most similar to Immigrants from Norway are Estonian ($51,772, a difference of 0.030%), Immigrants from Indonesia ($51,715, a difference of 0.080%), Egyptian ($51,701, a difference of 0.11%), Immigrants from Austria ($51,826, a difference of 0.13%), and Immigrants from Pakistan ($51,693, a difference of 0.13%).
| Demographics | Rating | Rank | Median Earnings |
| Bhutanese | 100.0 /100 | #46 | Exceptional $52,297 |
| Australians | 100.0 /100 | #47 | Exceptional $52,294 |
| Immigrants | Europe | 100.0 /100 | #48 | Exceptional $52,195 |
| Bolivians | 100.0 /100 | #49 | Exceptional $52,005 |
| Immigrants | South Africa | 100.0 /100 | #50 | Exceptional $51,850 |
| Immigrants | Austria | 99.9 /100 | #51 | Exceptional $51,826 |
| Estonians | 99.9 /100 | #52 | Exceptional $51,772 |
| Immigrants | Norway | 99.9 /100 | #53 | Exceptional $51,758 |
| Immigrants | Indonesia | 99.9 /100 | #54 | Exceptional $51,715 |
| Egyptians | 99.9 /100 | #55 | Exceptional $51,701 |
| Immigrants | Pakistan | 99.9 /100 | #56 | Exceptional $51,693 |
| Immigrants | Eastern Europe | 99.9 /100 | #57 | Exceptional $51,624 |
| Immigrants | Bolivia | 99.9 /100 | #58 | Exceptional $51,605 |
| Immigrants | Croatia | 99.9 /100 | #59 | Exceptional $51,581 |
| Immigrants | Serbia | 99.9 /100 | #60 | Exceptional $51,557 |