Immigrants from Norway vs Immigrants from Ghana Median Earnings
COMPARE
Immigrants from Norway
Immigrants from Ghana
Median Earnings
Median Earnings Comparison
Immigrants from Norway
Immigrants from Ghana
$51,758
MEDIAN EARNINGS
99.9/ 100
METRIC RATING
53rd/ 347
METRIC RANK
$45,641
MEDIAN EARNINGS
24.8/ 100
METRIC RATING
206th/ 347
METRIC RANK
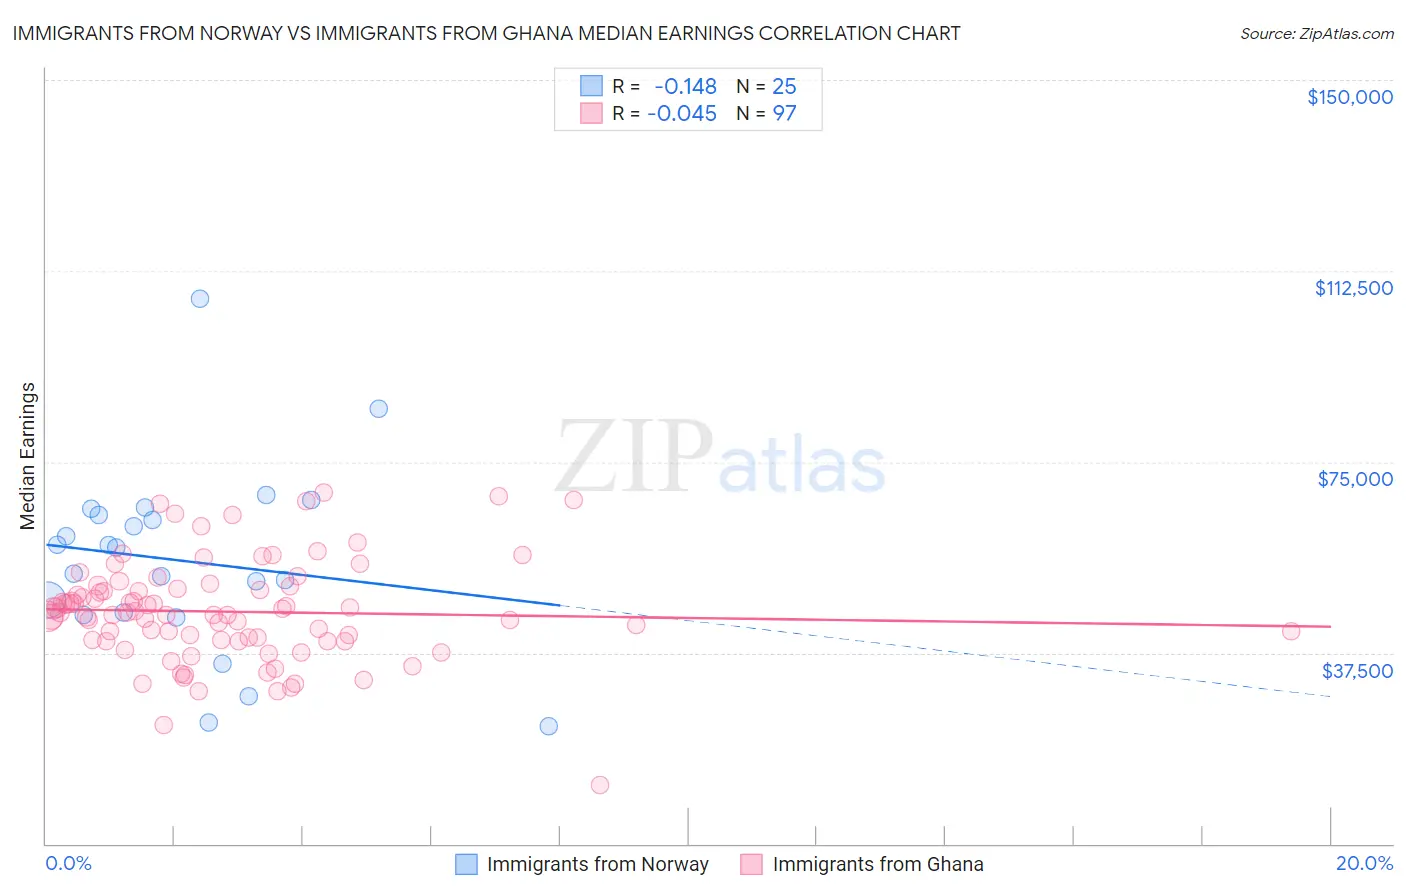
Immigrants from Norway vs Immigrants from Ghana Median Earnings Correlation Chart
The statistical analysis conducted on geographies consisting of 116,707,889 people shows a poor negative correlation between the proportion of Immigrants from Norway and median earnings in the United States with a correlation coefficient (R) of -0.148 and weighted average of $51,758. Similarly, the statistical analysis conducted on geographies consisting of 199,945,483 people shows no correlation between the proportion of Immigrants from Ghana and median earnings in the United States with a correlation coefficient (R) of -0.045 and weighted average of $45,641, a difference of 13.4%.
Median Earnings Correlation Summary
| Measurement | Immigrants from Norway | Immigrants from Ghana |
| Minimum | $23,125 | $11,479 |
| Maximum | $106,979 | $69,009 |
| Range | $83,854 | $57,530 |
| Mean | $55,577 | $45,584 |
| Median | $58,159 | $45,406 |
| Interquartile 25% (IQ1) | $45,162 | $39,912 |
| Interquartile 75% (IQ3) | $65,163 | $50,257 |
| Interquartile Range (IQR) | $20,000 | $10,345 |
| Standard Deviation (Sample) | $18,163 | $10,012 |
| Standard Deviation (Population) | $17,796 | $9,960 |
Similar Demographics by Median Earnings
Demographics Similar to Immigrants from Norway by Median Earnings
In terms of median earnings, the demographic groups most similar to Immigrants from Norway are Estonian ($51,772, a difference of 0.030%), Immigrants from Indonesia ($51,715, a difference of 0.080%), Egyptian ($51,701, a difference of 0.11%), Immigrants from Austria ($51,826, a difference of 0.13%), and Immigrants from Pakistan ($51,693, a difference of 0.13%).
| Demographics | Rating | Rank | Median Earnings |
| Bhutanese | 100.0 /100 | #46 | Exceptional $52,297 |
| Australians | 100.0 /100 | #47 | Exceptional $52,294 |
| Immigrants | Europe | 100.0 /100 | #48 | Exceptional $52,195 |
| Bolivians | 100.0 /100 | #49 | Exceptional $52,005 |
| Immigrants | South Africa | 100.0 /100 | #50 | Exceptional $51,850 |
| Immigrants | Austria | 99.9 /100 | #51 | Exceptional $51,826 |
| Estonians | 99.9 /100 | #52 | Exceptional $51,772 |
| Immigrants | Norway | 99.9 /100 | #53 | Exceptional $51,758 |
| Immigrants | Indonesia | 99.9 /100 | #54 | Exceptional $51,715 |
| Egyptians | 99.9 /100 | #55 | Exceptional $51,701 |
| Immigrants | Pakistan | 99.9 /100 | #56 | Exceptional $51,693 |
| Immigrants | Eastern Europe | 99.9 /100 | #57 | Exceptional $51,624 |
| Immigrants | Bolivia | 99.9 /100 | #58 | Exceptional $51,605 |
| Immigrants | Croatia | 99.9 /100 | #59 | Exceptional $51,581 |
| Immigrants | Serbia | 99.9 /100 | #60 | Exceptional $51,557 |
Demographics Similar to Immigrants from Ghana by Median Earnings
In terms of median earnings, the demographic groups most similar to Immigrants from Ghana are Tongan ($45,665, a difference of 0.050%), Immigrants from Senegal ($45,611, a difference of 0.070%), Immigrants from Uruguay ($45,682, a difference of 0.090%), Immigrants from Bosnia and Herzegovina ($45,600, a difference of 0.090%), and Immigrants from Thailand ($45,598, a difference of 0.10%).
| Demographics | Rating | Rank | Median Earnings |
| Immigrants | Barbados | 29.6 /100 | #199 | Fair $45,816 |
| Immigrants | Azores | 29.5 /100 | #200 | Fair $45,812 |
| Celtics | 27.2 /100 | #201 | Fair $45,732 |
| Immigrants | Trinidad and Tobago | 27.1 /100 | #202 | Fair $45,729 |
| Welsh | 26.6 /100 | #203 | Fair $45,710 |
| Immigrants | Uruguay | 25.9 /100 | #204 | Fair $45,682 |
| Tongans | 25.4 /100 | #205 | Fair $45,665 |
| Immigrants | Ghana | 24.8 /100 | #206 | Fair $45,641 |
| Immigrants | Senegal | 24.0 /100 | #207 | Fair $45,611 |
| Immigrants | Bosnia and Herzegovina | 23.7 /100 | #208 | Fair $45,600 |
| Immigrants | Thailand | 23.7 /100 | #209 | Fair $45,598 |
| Immigrants | Grenada | 23.6 /100 | #210 | Fair $45,596 |
| Panamanians | 23.5 /100 | #211 | Fair $45,593 |
| Bermudans | 23.5 /100 | #212 | Fair $45,593 |
| Immigrants | Colombia | 22.4 /100 | #213 | Fair $45,550 |