Sierra Leonean vs Kenyan Householder Income Ages 45 - 64 years
COMPARE
Sierra Leonean
Kenyan
Householder Income Ages 45 - 64 years
Householder Income Ages 45 - 64 years Comparison
Sierra Leoneans
Kenyans
$102,427
HOUSEHOLDER INCOME AGES 45 - 64 YEARS
74.2/ 100
METRIC RATING
159th/ 347
METRIC RANK
$98,970
HOUSEHOLDER INCOME AGES 45 - 64 YEARS
33.7/ 100
METRIC RATING
191st/ 347
METRIC RANK
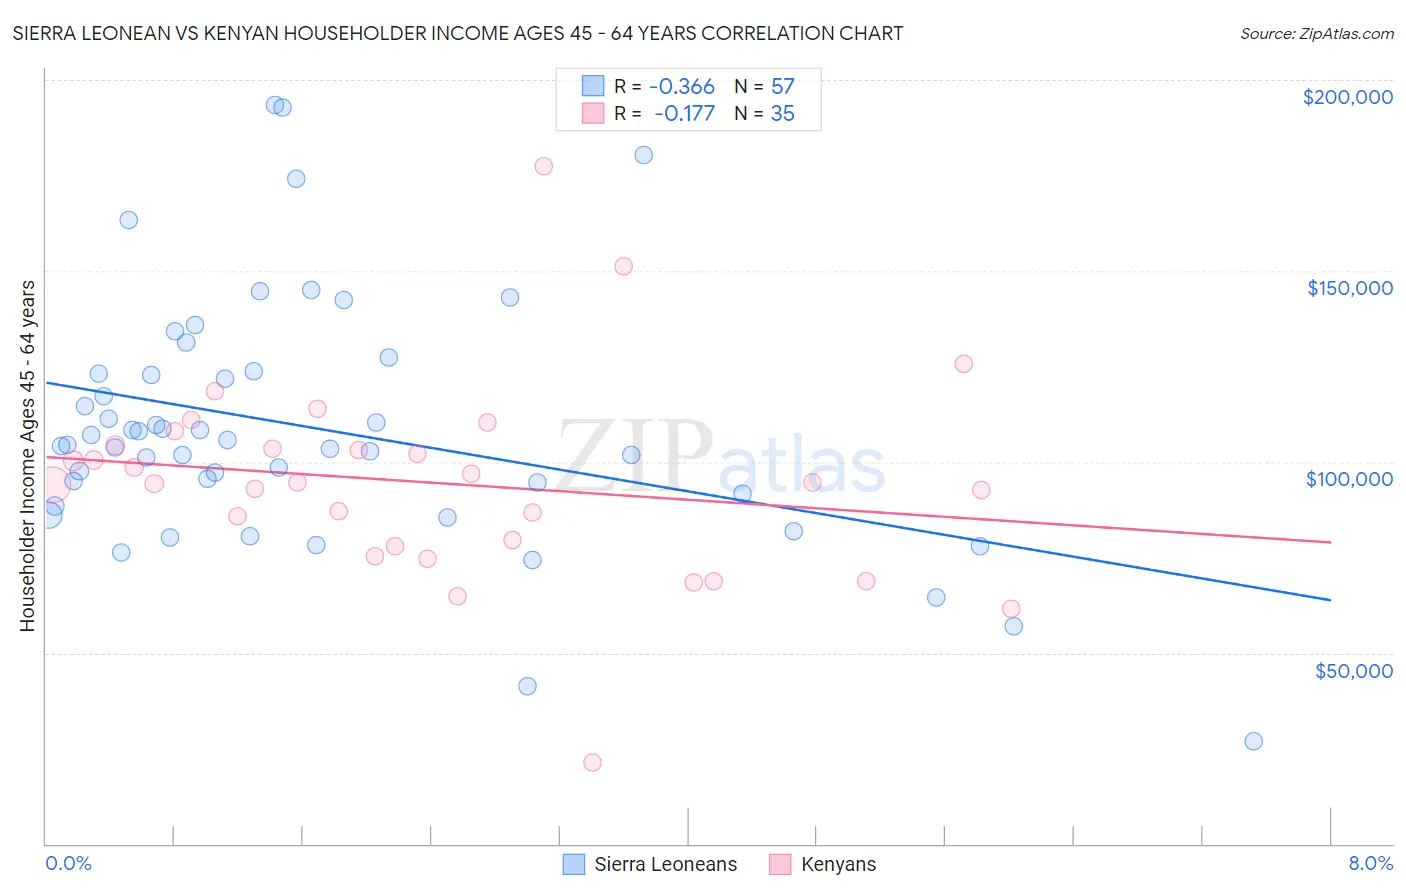
Sierra Leonean vs Kenyan Householder Income Ages 45 - 64 years Correlation Chart
The statistical analysis conducted on geographies consisting of 83,324,243 people shows a mild negative correlation between the proportion of Sierra Leoneans and household income with householder between the ages 45 and 64 in the United States with a correlation coefficient (R) of -0.366 and weighted average of $102,427. Similarly, the statistical analysis conducted on geographies consisting of 168,091,431 people shows a poor negative correlation between the proportion of Kenyans and household income with householder between the ages 45 and 64 in the United States with a correlation coefficient (R) of -0.177 and weighted average of $98,970, a difference of 3.5%.
Householder Income Ages 45 - 64 years Correlation Summary
| Measurement | Sierra Leonean | Kenyan |
| Minimum | $26,764 | $21,397 |
| Maximum | $193,348 | $177,411 |
| Range | $166,584 | $156,014 |
| Mean | $108,787 | $94,546 |
| Median | $104,388 | $94,444 |
| Interquartile 25% (IQ1) | $89,997 | $77,946 |
| Interquartile 75% (IQ3) | $123,470 | $104,327 |
| Interquartile Range (IQR) | $33,473 | $26,381 |
| Standard Deviation (Sample) | $32,726 | $26,525 |
| Standard Deviation (Population) | $32,438 | $26,144 |
Similar Demographics by Householder Income Ages 45 - 64 years
Demographics Similar to Sierra Leoneans by Householder Income Ages 45 - 64 years
In terms of householder income ages 45 - 64 years, the demographic groups most similar to Sierra Leoneans are Icelander ($102,261, a difference of 0.16%), Slavic ($102,629, a difference of 0.20%), Immigrants from Nepal ($102,190, a difference of 0.23%), Scottish ($102,123, a difference of 0.30%), and Immigrants from Ethiopia ($102,763, a difference of 0.33%).
| Demographics | Rating | Rank | Householder Income Ages 45 - 64 years |
| Irish | 79.8 /100 | #152 | Good $103,067 |
| Scandinavians | 79.0 /100 | #153 | Good $102,969 |
| Slovenes | 78.3 /100 | #154 | Good $102,885 |
| Costa Ricans | 77.4 /100 | #155 | Good $102,779 |
| Carpatho Rusyns | 77.4 /100 | #156 | Good $102,777 |
| Immigrants | Ethiopia | 77.3 /100 | #157 | Good $102,763 |
| Slavs | 76.1 /100 | #158 | Good $102,629 |
| Sierra Leoneans | 74.2 /100 | #159 | Good $102,427 |
| Icelanders | 72.5 /100 | #160 | Good $102,261 |
| Immigrants | Nepal | 71.8 /100 | #161 | Good $102,190 |
| Scottish | 71.1 /100 | #162 | Good $102,123 |
| English | 70.1 /100 | #163 | Good $102,021 |
| Immigrants | Morocco | 70.0 /100 | #164 | Good $102,015 |
| Immigrants | Albania | 69.4 /100 | #165 | Good $101,957 |
| Samoans | 65.3 /100 | #166 | Good $101,580 |
Demographics Similar to Kenyans by Householder Income Ages 45 - 64 years
In terms of householder income ages 45 - 64 years, the demographic groups most similar to Kenyans are Celtic ($98,896, a difference of 0.070%), French Canadian ($99,093, a difference of 0.12%), Immigrants from South America ($99,126, a difference of 0.16%), Hawaiian ($98,778, a difference of 0.19%), and Immigrants from Portugal ($99,203, a difference of 0.24%).
| Demographics | Rating | Rank | Householder Income Ages 45 - 64 years |
| French | 43.8 /100 | #184 | Average $99,824 |
| Colombians | 43.2 /100 | #185 | Average $99,772 |
| Dutch | 41.7 /100 | #186 | Average $99,650 |
| Iraqis | 38.5 /100 | #187 | Fair $99,387 |
| Immigrants | Portugal | 36.3 /100 | #188 | Fair $99,203 |
| Immigrants | South America | 35.4 /100 | #189 | Fair $99,126 |
| French Canadians | 35.1 /100 | #190 | Fair $99,093 |
| Kenyans | 33.7 /100 | #191 | Fair $98,970 |
| Celtics | 32.9 /100 | #192 | Fair $98,896 |
| Hawaiians | 31.6 /100 | #193 | Fair $98,778 |
| Uruguayans | 30.3 /100 | #194 | Fair $98,660 |
| Spanish | 29.2 /100 | #195 | Fair $98,554 |
| Immigrants | Eastern Africa | 28.3 /100 | #196 | Fair $98,467 |
| Puget Sound Salish | 27.0 /100 | #197 | Fair $98,340 |
| Immigrants | Iraq | 25.7 /100 | #198 | Fair $98,201 |