Sierra Leonean vs Pima Householder Income Ages 45 - 64 years
COMPARE
Sierra Leonean
Pima
Householder Income Ages 45 - 64 years
Householder Income Ages 45 - 64 years Comparison
Sierra Leoneans
Pima
$102,427
HOUSEHOLDER INCOME AGES 45 - 64 YEARS
74.2/ 100
METRIC RATING
159th/ 347
METRIC RANK
$73,365
HOUSEHOLDER INCOME AGES 45 - 64 YEARS
0.0/ 100
METRIC RATING
343rd/ 347
METRIC RANK
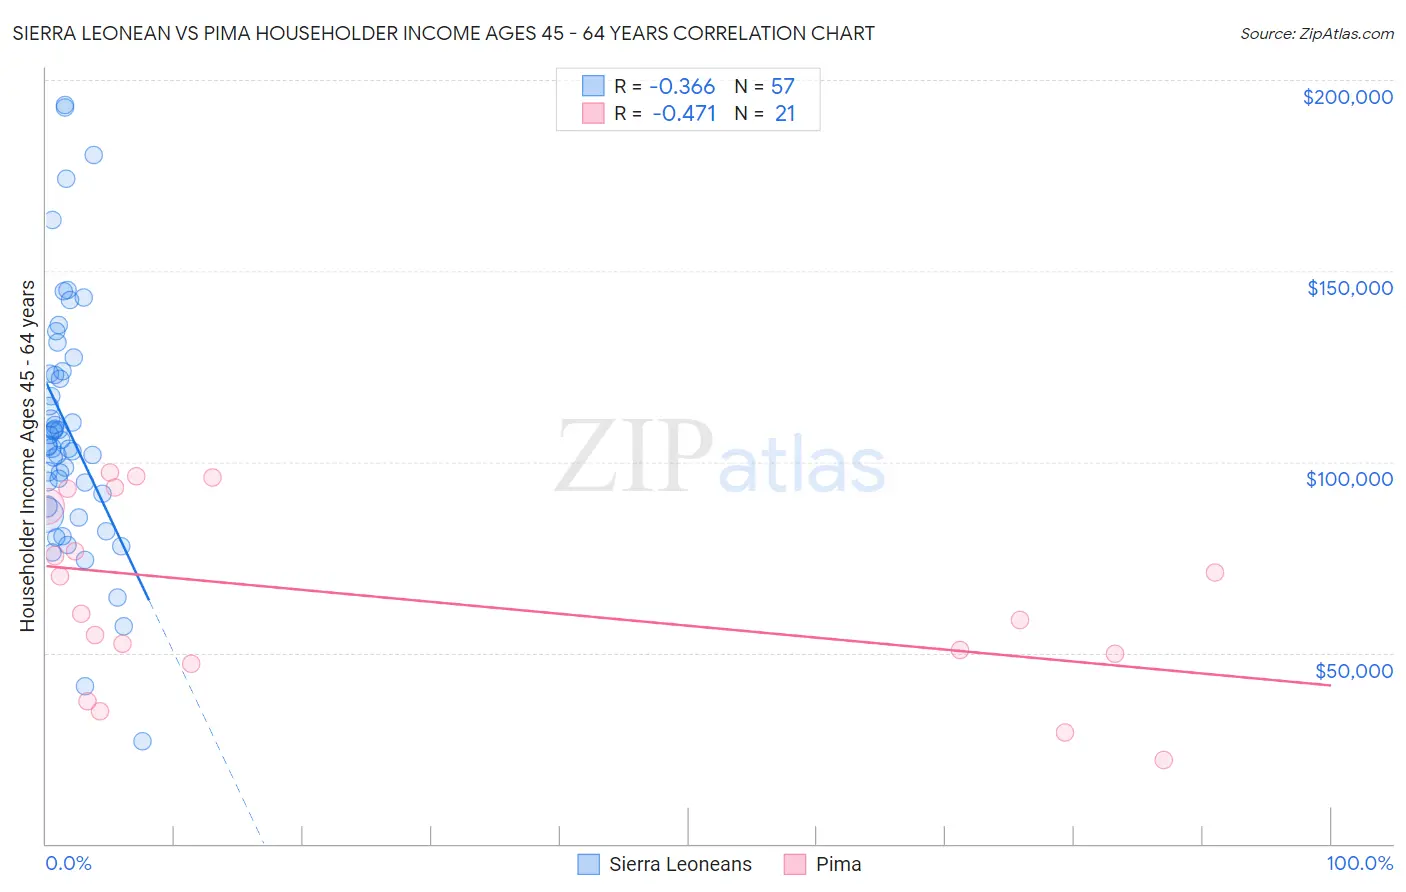
Sierra Leonean vs Pima Householder Income Ages 45 - 64 years Correlation Chart
The statistical analysis conducted on geographies consisting of 83,324,243 people shows a mild negative correlation between the proportion of Sierra Leoneans and household income with householder between the ages 45 and 64 in the United States with a correlation coefficient (R) of -0.366 and weighted average of $102,427. Similarly, the statistical analysis conducted on geographies consisting of 61,504,039 people shows a moderate negative correlation between the proportion of Pima and household income with householder between the ages 45 and 64 in the United States with a correlation coefficient (R) of -0.471 and weighted average of $73,365, a difference of 39.6%.
Householder Income Ages 45 - 64 years Correlation Summary
| Measurement | Sierra Leonean | Pima |
| Minimum | $26,764 | $22,031 |
| Maximum | $193,348 | $97,330 |
| Range | $166,584 | $75,299 |
| Mean | $108,787 | $64,464 |
| Median | $104,388 | $60,256 |
| Interquartile 25% (IQ1) | $89,997 | $48,406 |
| Interquartile 75% (IQ3) | $123,470 | $90,706 |
| Interquartile Range (IQR) | $33,473 | $42,300 |
| Standard Deviation (Sample) | $32,726 | $23,791 |
| Standard Deviation (Population) | $32,438 | $23,218 |
Similar Demographics by Householder Income Ages 45 - 64 years
Demographics Similar to Sierra Leoneans by Householder Income Ages 45 - 64 years
In terms of householder income ages 45 - 64 years, the demographic groups most similar to Sierra Leoneans are Icelander ($102,261, a difference of 0.16%), Slavic ($102,629, a difference of 0.20%), Immigrants from Nepal ($102,190, a difference of 0.23%), Scottish ($102,123, a difference of 0.30%), and Immigrants from Ethiopia ($102,763, a difference of 0.33%).
| Demographics | Rating | Rank | Householder Income Ages 45 - 64 years |
| Irish | 79.8 /100 | #152 | Good $103,067 |
| Scandinavians | 79.0 /100 | #153 | Good $102,969 |
| Slovenes | 78.3 /100 | #154 | Good $102,885 |
| Costa Ricans | 77.4 /100 | #155 | Good $102,779 |
| Carpatho Rusyns | 77.4 /100 | #156 | Good $102,777 |
| Immigrants | Ethiopia | 77.3 /100 | #157 | Good $102,763 |
| Slavs | 76.1 /100 | #158 | Good $102,629 |
| Sierra Leoneans | 74.2 /100 | #159 | Good $102,427 |
| Icelanders | 72.5 /100 | #160 | Good $102,261 |
| Immigrants | Nepal | 71.8 /100 | #161 | Good $102,190 |
| Scottish | 71.1 /100 | #162 | Good $102,123 |
| English | 70.1 /100 | #163 | Good $102,021 |
| Immigrants | Morocco | 70.0 /100 | #164 | Good $102,015 |
| Immigrants | Albania | 69.4 /100 | #165 | Good $101,957 |
| Samoans | 65.3 /100 | #166 | Good $101,580 |
Demographics Similar to Pima by Householder Income Ages 45 - 64 years
In terms of householder income ages 45 - 64 years, the demographic groups most similar to Pima are Tohono O'odham ($73,774, a difference of 0.56%), Crow ($74,257, a difference of 1.2%), Immigrants from Yemen ($74,575, a difference of 1.7%), Houma ($72,093, a difference of 1.8%), and Kiowa ($74,815, a difference of 2.0%).
| Demographics | Rating | Rank | Householder Income Ages 45 - 64 years |
| Immigrants | Congo | 0.0 /100 | #333 | Tragic $77,850 |
| Menominee | 0.0 /100 | #334 | Tragic $76,903 |
| Cheyenne | 0.0 /100 | #335 | Tragic $76,362 |
| Arapaho | 0.0 /100 | #336 | Tragic $75,945 |
| Pueblo | 0.0 /100 | #337 | Tragic $75,601 |
| Hopi | 0.0 /100 | #338 | Tragic $75,562 |
| Kiowa | 0.0 /100 | #339 | Tragic $74,815 |
| Immigrants | Yemen | 0.0 /100 | #340 | Tragic $74,575 |
| Crow | 0.0 /100 | #341 | Tragic $74,257 |
| Tohono O'odham | 0.0 /100 | #342 | Tragic $73,774 |
| Pima | 0.0 /100 | #343 | Tragic $73,365 |
| Houma | 0.0 /100 | #344 | Tragic $72,093 |
| Navajo | 0.0 /100 | #345 | Tragic $69,759 |
| Puerto Ricans | 0.0 /100 | #346 | Tragic $69,234 |
| Lumbee | 0.0 /100 | #347 | Tragic $65,113 |