Sierra Leonean vs Immigrants from Nigeria Median Family Income
COMPARE
Sierra Leonean
Immigrants from Nigeria
Median Family Income
Median Family Income Comparison
Sierra Leoneans
Immigrants from Nigeria
$103,859
MEDIAN FAMILY INCOME
64.7/ 100
METRIC RATING
164th/ 347
METRIC RANK
$96,439
MEDIAN FAMILY INCOME
4.0/ 100
METRIC RATING
222nd/ 347
METRIC RANK
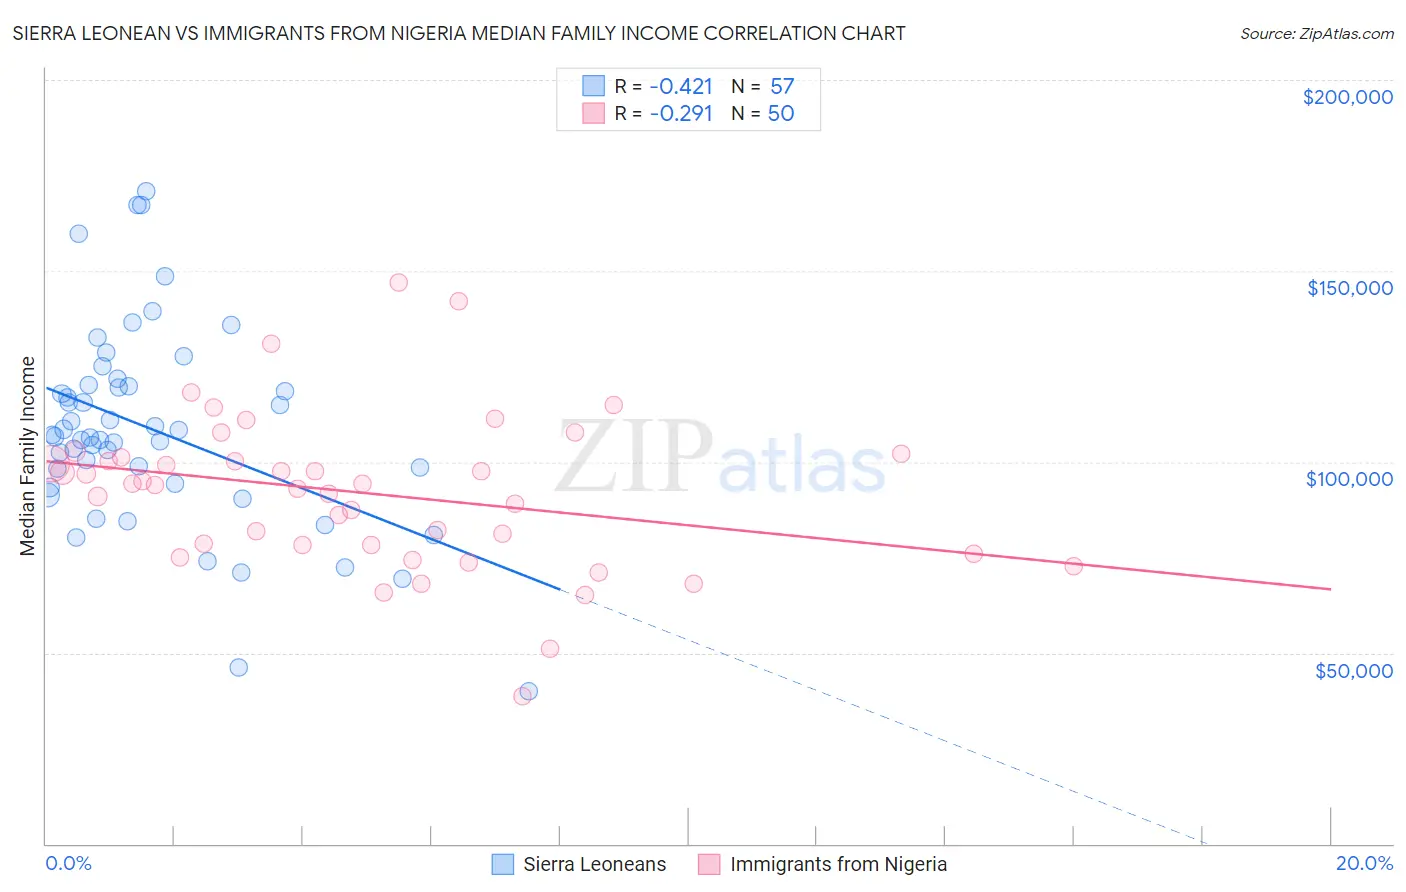
Sierra Leonean vs Immigrants from Nigeria Median Family Income Correlation Chart
The statistical analysis conducted on geographies consisting of 83,335,449 people shows a moderate negative correlation between the proportion of Sierra Leoneans and median family income in the United States with a correlation coefficient (R) of -0.421 and weighted average of $103,859. Similarly, the statistical analysis conducted on geographies consisting of 283,210,915 people shows a weak negative correlation between the proportion of Immigrants from Nigeria and median family income in the United States with a correlation coefficient (R) of -0.291 and weighted average of $96,439, a difference of 7.7%.
Median Family Income Correlation Summary
| Measurement | Sierra Leonean | Immigrants from Nigeria |
| Minimum | $39,837 | $38,750 |
| Maximum | $170,916 | $147,129 |
| Range | $131,079 | $108,379 |
| Mean | $108,328 | $91,848 |
| Median | $106,551 | $94,194 |
| Interquartile 25% (IQ1) | $93,816 | $78,280 |
| Interquartile 75% (IQ3) | $120,017 | $101,295 |
| Interquartile Range (IQR) | $26,201 | $23,014 |
| Standard Deviation (Sample) | $26,389 | $20,578 |
| Standard Deviation (Population) | $26,156 | $20,371 |
Similar Demographics by Median Family Income
Demographics Similar to Sierra Leoneans by Median Family Income
In terms of median family income, the demographic groups most similar to Sierra Leoneans are Immigrants from Sierra Leone ($103,990, a difference of 0.13%), Costa Rican ($103,989, a difference of 0.13%), Slovak ($103,729, a difference of 0.13%), English ($103,684, a difference of 0.17%), and South American Indian ($103,624, a difference of 0.23%).
| Demographics | Rating | Rank | Median Family Income |
| Moroccans | 71.6 /100 | #157 | Good $104,488 |
| Scandinavians | 70.8 /100 | #158 | Good $104,410 |
| Swiss | 70.7 /100 | #159 | Good $104,396 |
| Scottish | 69.5 /100 | #160 | Good $104,288 |
| Icelanders | 69.4 /100 | #161 | Good $104,282 |
| Immigrants | Sierra Leone | 66.2 /100 | #162 | Good $103,990 |
| Costa Ricans | 66.2 /100 | #163 | Good $103,989 |
| Sierra Leoneans | 64.7 /100 | #164 | Good $103,859 |
| Slovaks | 63.1 /100 | #165 | Good $103,729 |
| English | 62.6 /100 | #166 | Good $103,684 |
| South American Indians | 61.9 /100 | #167 | Good $103,624 |
| Immigrants | Peru | 60.8 /100 | #168 | Good $103,534 |
| Czechoslovakians | 57.6 /100 | #169 | Average $103,273 |
| Immigrants | Uzbekistan | 56.6 /100 | #170 | Average $103,197 |
| Alsatians | 54.3 /100 | #171 | Average $103,010 |
Demographics Similar to Immigrants from Nigeria by Median Family Income
In terms of median family income, the demographic groups most similar to Immigrants from Nigeria are Immigrants from Ghana ($96,544, a difference of 0.11%), Venezuelan ($96,281, a difference of 0.16%), Nonimmigrants ($96,231, a difference of 0.22%), Vietnamese ($96,123, a difference of 0.33%), and Sudanese ($96,783, a difference of 0.36%).
| Demographics | Rating | Rank | Median Family Income |
| Nigerians | 6.7 /100 | #215 | Tragic $97,522 |
| Immigrants | Bosnia and Herzegovina | 6.4 /100 | #216 | Tragic $97,432 |
| Japanese | 6.0 /100 | #217 | Tragic $97,288 |
| Immigrants | Cambodia | 5.8 /100 | #218 | Tragic $97,222 |
| Delaware | 5.1 /100 | #219 | Tragic $96,958 |
| Sudanese | 4.7 /100 | #220 | Tragic $96,783 |
| Immigrants | Ghana | 4.2 /100 | #221 | Tragic $96,544 |
| Immigrants | Nigeria | 4.0 /100 | #222 | Tragic $96,439 |
| Venezuelans | 3.7 /100 | #223 | Tragic $96,281 |
| Immigrants | Nonimmigrants | 3.6 /100 | #224 | Tragic $96,231 |
| Vietnamese | 3.4 /100 | #225 | Tragic $96,123 |
| Immigrants | Panama | 2.7 /100 | #226 | Tragic $95,647 |
| Alaska Natives | 2.6 /100 | #227 | Tragic $95,573 |
| Immigrants | Azores | 2.4 /100 | #228 | Tragic $95,402 |
| Marshallese | 2.2 /100 | #229 | Tragic $95,293 |