Lumbee vs Kenyan Householder Income Ages 45 - 64 years
COMPARE
Lumbee
Kenyan
Householder Income Ages 45 - 64 years
Householder Income Ages 45 - 64 years Comparison
Lumbee
Kenyans
$65,113
HOUSEHOLDER INCOME AGES 45 - 64 YEARS
0.0/ 100
METRIC RATING
347th/ 347
METRIC RANK
$98,970
HOUSEHOLDER INCOME AGES 45 - 64 YEARS
33.7/ 100
METRIC RATING
191st/ 347
METRIC RANK
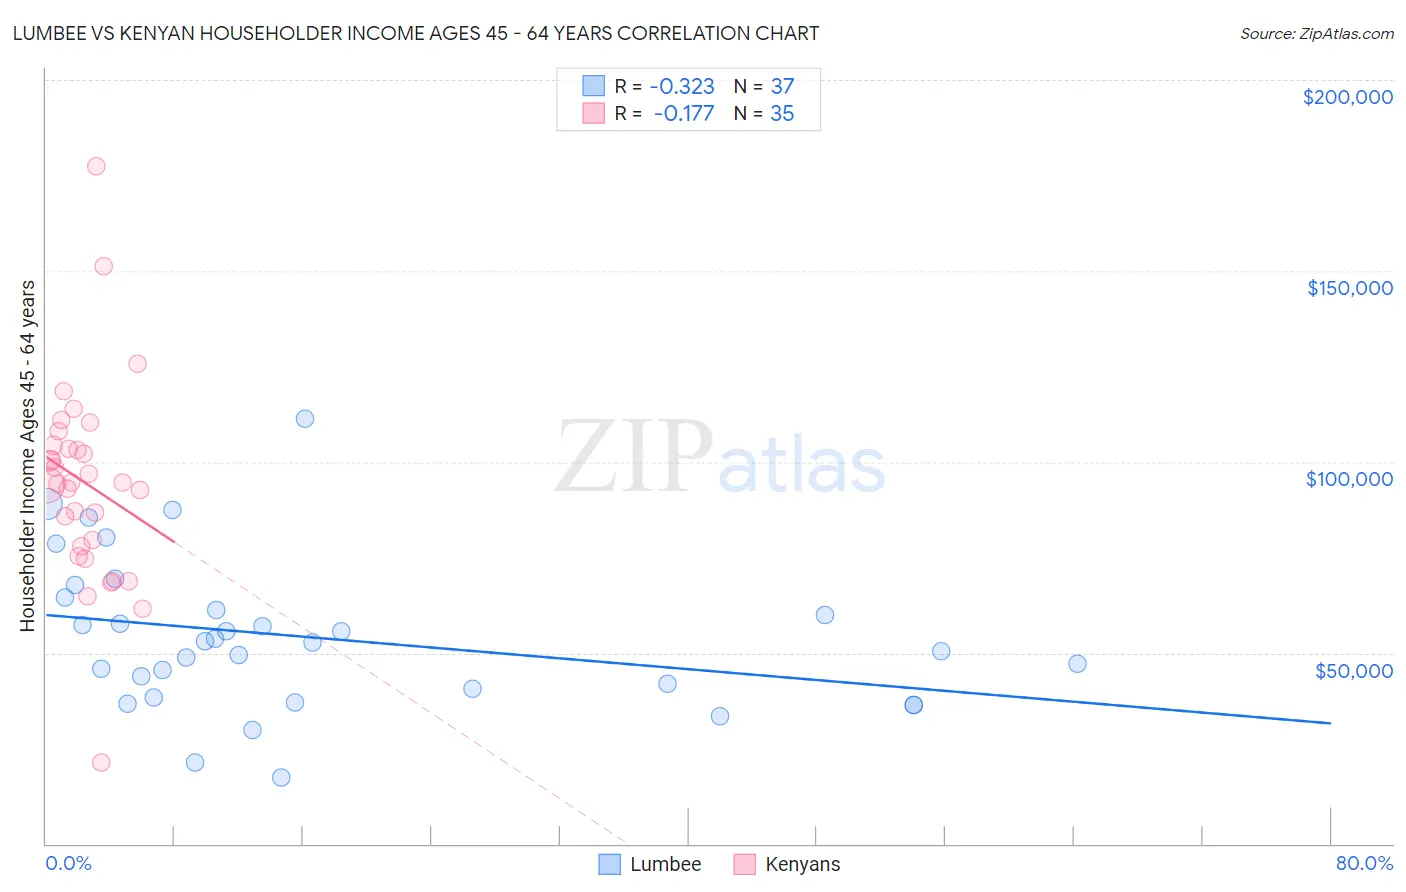
Lumbee vs Kenyan Householder Income Ages 45 - 64 years Correlation Chart
The statistical analysis conducted on geographies consisting of 92,190,651 people shows a mild negative correlation between the proportion of Lumbee and household income with householder between the ages 45 and 64 in the United States with a correlation coefficient (R) of -0.323 and weighted average of $65,113. Similarly, the statistical analysis conducted on geographies consisting of 168,091,431 people shows a poor negative correlation between the proportion of Kenyans and household income with householder between the ages 45 and 64 in the United States with a correlation coefficient (R) of -0.177 and weighted average of $98,970, a difference of 52.0%.
Householder Income Ages 45 - 64 years Correlation Summary
| Measurement | Lumbee | Kenyan |
| Minimum | $17,237 | $21,397 |
| Maximum | $111,146 | $177,411 |
| Range | $93,909 | $156,014 |
| Mean | $53,963 | $94,546 |
| Median | $52,786 | $94,444 |
| Interquartile 25% (IQ1) | $39,477 | $77,946 |
| Interquartile 75% (IQ3) | $62,870 | $104,327 |
| Interquartile Range (IQR) | $23,393 | $26,381 |
| Standard Deviation (Sample) | $19,805 | $26,525 |
| Standard Deviation (Population) | $19,536 | $26,144 |
Similar Demographics by Householder Income Ages 45 - 64 years
Demographics Similar to Lumbee by Householder Income Ages 45 - 64 years
In terms of householder income ages 45 - 64 years, the demographic groups most similar to Lumbee are Puerto Rican ($69,234, a difference of 6.3%), Navajo ($69,759, a difference of 7.1%), Houma ($72,093, a difference of 10.7%), Pima ($73,365, a difference of 12.7%), and Tohono O'odham ($73,774, a difference of 13.3%).
| Demographics | Rating | Rank | Householder Income Ages 45 - 64 years |
| Immigrants | Congo | 0.0 /100 | #333 | Tragic $77,850 |
| Menominee | 0.0 /100 | #334 | Tragic $76,903 |
| Cheyenne | 0.0 /100 | #335 | Tragic $76,362 |
| Arapaho | 0.0 /100 | #336 | Tragic $75,945 |
| Pueblo | 0.0 /100 | #337 | Tragic $75,601 |
| Hopi | 0.0 /100 | #338 | Tragic $75,562 |
| Kiowa | 0.0 /100 | #339 | Tragic $74,815 |
| Immigrants | Yemen | 0.0 /100 | #340 | Tragic $74,575 |
| Crow | 0.0 /100 | #341 | Tragic $74,257 |
| Tohono O'odham | 0.0 /100 | #342 | Tragic $73,774 |
| Pima | 0.0 /100 | #343 | Tragic $73,365 |
| Houma | 0.0 /100 | #344 | Tragic $72,093 |
| Navajo | 0.0 /100 | #345 | Tragic $69,759 |
| Puerto Ricans | 0.0 /100 | #346 | Tragic $69,234 |
| Lumbee | 0.0 /100 | #347 | Tragic $65,113 |
Demographics Similar to Kenyans by Householder Income Ages 45 - 64 years
In terms of householder income ages 45 - 64 years, the demographic groups most similar to Kenyans are Celtic ($98,896, a difference of 0.070%), French Canadian ($99,093, a difference of 0.12%), Immigrants from South America ($99,126, a difference of 0.16%), Hawaiian ($98,778, a difference of 0.19%), and Immigrants from Portugal ($99,203, a difference of 0.24%).
| Demographics | Rating | Rank | Householder Income Ages 45 - 64 years |
| French | 43.8 /100 | #184 | Average $99,824 |
| Colombians | 43.2 /100 | #185 | Average $99,772 |
| Dutch | 41.7 /100 | #186 | Average $99,650 |
| Iraqis | 38.5 /100 | #187 | Fair $99,387 |
| Immigrants | Portugal | 36.3 /100 | #188 | Fair $99,203 |
| Immigrants | South America | 35.4 /100 | #189 | Fair $99,126 |
| French Canadians | 35.1 /100 | #190 | Fair $99,093 |
| Kenyans | 33.7 /100 | #191 | Fair $98,970 |
| Celtics | 32.9 /100 | #192 | Fair $98,896 |
| Hawaiians | 31.6 /100 | #193 | Fair $98,778 |
| Uruguayans | 30.3 /100 | #194 | Fair $98,660 |
| Spanish | 29.2 /100 | #195 | Fair $98,554 |
| Immigrants | Eastern Africa | 28.3 /100 | #196 | Fair $98,467 |
| Puget Sound Salish | 27.0 /100 | #197 | Fair $98,340 |
| Immigrants | Iraq | 25.7 /100 | #198 | Fair $98,201 |