Greek vs Kenyan Householder Income Ages 45 - 64 years
COMPARE
Greek
Kenyan
Householder Income Ages 45 - 64 years
Householder Income Ages 45 - 64 years Comparison
Greeks
Kenyans
$112,630
HOUSEHOLDER INCOME AGES 45 - 64 YEARS
99.8/ 100
METRIC RATING
54th/ 347
METRIC RANK
$98,970
HOUSEHOLDER INCOME AGES 45 - 64 YEARS
33.7/ 100
METRIC RATING
191st/ 347
METRIC RANK
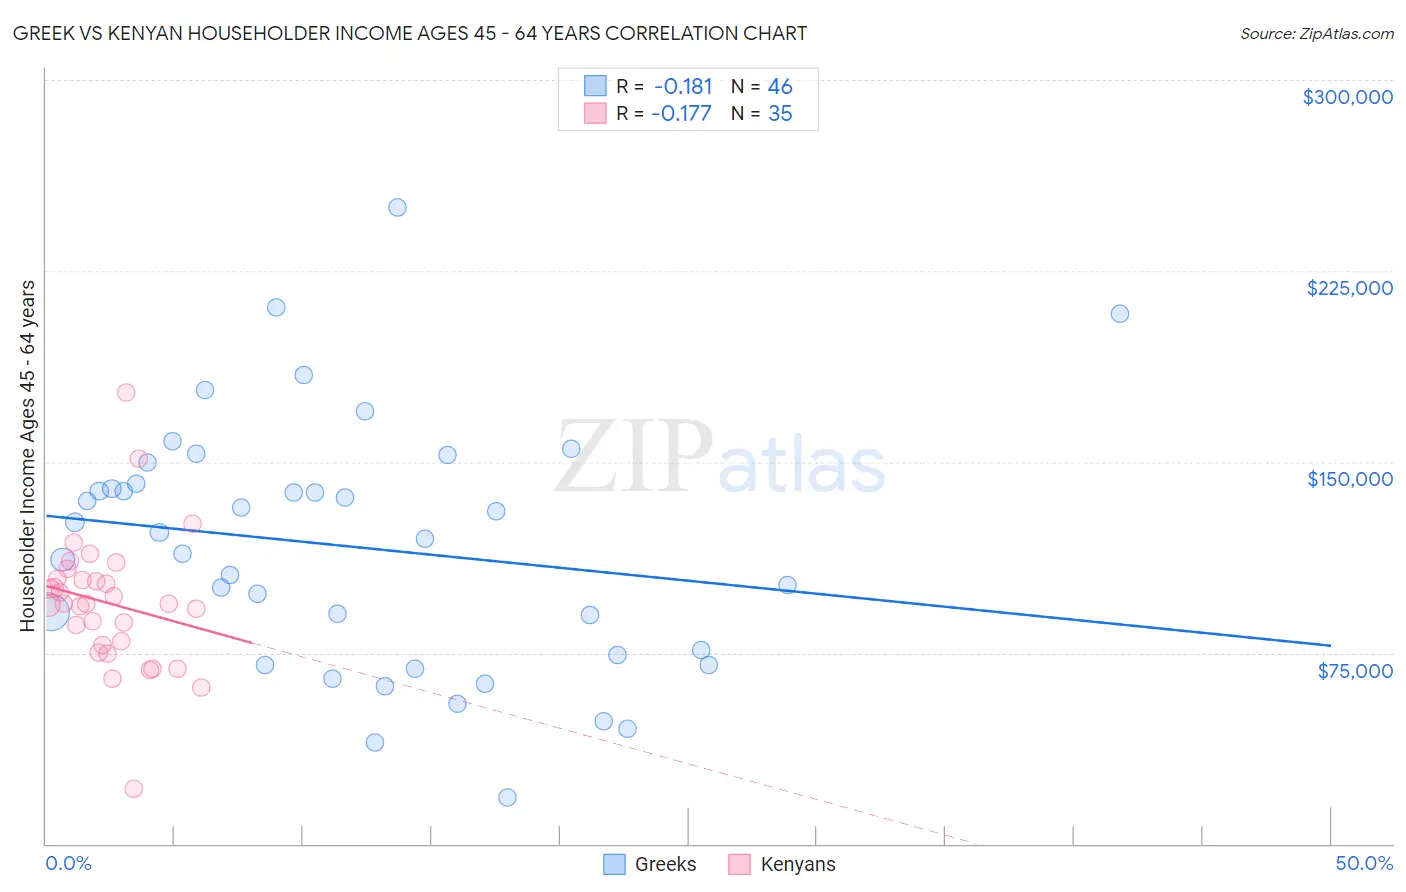
Greek vs Kenyan Householder Income Ages 45 - 64 years Correlation Chart
The statistical analysis conducted on geographies consisting of 481,485,565 people shows a poor negative correlation between the proportion of Greeks and household income with householder between the ages 45 and 64 in the United States with a correlation coefficient (R) of -0.181 and weighted average of $112,630. Similarly, the statistical analysis conducted on geographies consisting of 168,091,431 people shows a poor negative correlation between the proportion of Kenyans and household income with householder between the ages 45 and 64 in the United States with a correlation coefficient (R) of -0.177 and weighted average of $98,970, a difference of 13.8%.
Householder Income Ages 45 - 64 years Correlation Summary
| Measurement | Greek | Kenyan |
| Minimum | $18,083 | $21,397 |
| Maximum | $250,001 | $177,411 |
| Range | $231,918 | $156,014 |
| Mean | $116,578 | $94,546 |
| Median | $121,059 | $94,444 |
| Interquartile 25% (IQ1) | $74,375 | $77,946 |
| Interquartile 75% (IQ3) | $141,576 | $104,327 |
| Interquartile Range (IQR) | $67,201 | $26,381 |
| Standard Deviation (Sample) | $49,084 | $26,525 |
| Standard Deviation (Population) | $48,548 | $26,144 |
Similar Demographics by Householder Income Ages 45 - 64 years
Demographics Similar to Greeks by Householder Income Ages 45 - 64 years
In terms of householder income ages 45 - 64 years, the demographic groups most similar to Greeks are Afghan ($112,676, a difference of 0.040%), Lithuanian ($112,484, a difference of 0.13%), Immigrants from Malaysia ($112,796, a difference of 0.15%), Immigrants from South Africa ($112,886, a difference of 0.23%), and Egyptian ($112,256, a difference of 0.33%).
| Demographics | Rating | Rank | Householder Income Ages 45 - 64 years |
| Australians | 99.9 /100 | #47 | Exceptional $113,533 |
| Immigrants | Indonesia | 99.9 /100 | #48 | Exceptional $113,519 |
| Immigrants | Russia | 99.8 /100 | #49 | Exceptional $113,215 |
| Immigrants | Austria | 99.8 /100 | #50 | Exceptional $113,140 |
| Immigrants | South Africa | 99.8 /100 | #51 | Exceptional $112,886 |
| Immigrants | Malaysia | 99.8 /100 | #52 | Exceptional $112,796 |
| Afghans | 99.8 /100 | #53 | Exceptional $112,676 |
| Greeks | 99.8 /100 | #54 | Exceptional $112,630 |
| Lithuanians | 99.8 /100 | #55 | Exceptional $112,484 |
| Egyptians | 99.7 /100 | #56 | Exceptional $112,256 |
| Immigrants | Scotland | 99.7 /100 | #57 | Exceptional $112,175 |
| Soviet Union | 99.7 /100 | #58 | Exceptional $112,008 |
| Immigrants | Europe | 99.7 /100 | #59 | Exceptional $111,984 |
| Immigrants | Netherlands | 99.7 /100 | #60 | Exceptional $111,982 |
| Immigrants | Czechoslovakia | 99.7 /100 | #61 | Exceptional $111,914 |
Demographics Similar to Kenyans by Householder Income Ages 45 - 64 years
In terms of householder income ages 45 - 64 years, the demographic groups most similar to Kenyans are Celtic ($98,896, a difference of 0.070%), French Canadian ($99,093, a difference of 0.12%), Immigrants from South America ($99,126, a difference of 0.16%), Hawaiian ($98,778, a difference of 0.19%), and Immigrants from Portugal ($99,203, a difference of 0.24%).
| Demographics | Rating | Rank | Householder Income Ages 45 - 64 years |
| French | 43.8 /100 | #184 | Average $99,824 |
| Colombians | 43.2 /100 | #185 | Average $99,772 |
| Dutch | 41.7 /100 | #186 | Average $99,650 |
| Iraqis | 38.5 /100 | #187 | Fair $99,387 |
| Immigrants | Portugal | 36.3 /100 | #188 | Fair $99,203 |
| Immigrants | South America | 35.4 /100 | #189 | Fair $99,126 |
| French Canadians | 35.1 /100 | #190 | Fair $99,093 |
| Kenyans | 33.7 /100 | #191 | Fair $98,970 |
| Celtics | 32.9 /100 | #192 | Fair $98,896 |
| Hawaiians | 31.6 /100 | #193 | Fair $98,778 |
| Uruguayans | 30.3 /100 | #194 | Fair $98,660 |
| Spanish | 29.2 /100 | #195 | Fair $98,554 |
| Immigrants | Eastern Africa | 28.3 /100 | #196 | Fair $98,467 |
| Puget Sound Salish | 27.0 /100 | #197 | Fair $98,340 |
| Immigrants | Iraq | 25.7 /100 | #198 | Fair $98,201 |