Immigrants from Costa Rica vs Kenyan Householder Income Ages 45 - 64 years
COMPARE
Immigrants from Costa Rica
Kenyan
Householder Income Ages 45 - 64 years
Householder Income Ages 45 - 64 years Comparison
Immigrants from Costa Rica
Kenyans
$100,141
HOUSEHOLDER INCOME AGES 45 - 64 YEARS
47.7/ 100
METRIC RATING
176th/ 347
METRIC RANK
$98,970
HOUSEHOLDER INCOME AGES 45 - 64 YEARS
33.7/ 100
METRIC RATING
191st/ 347
METRIC RANK
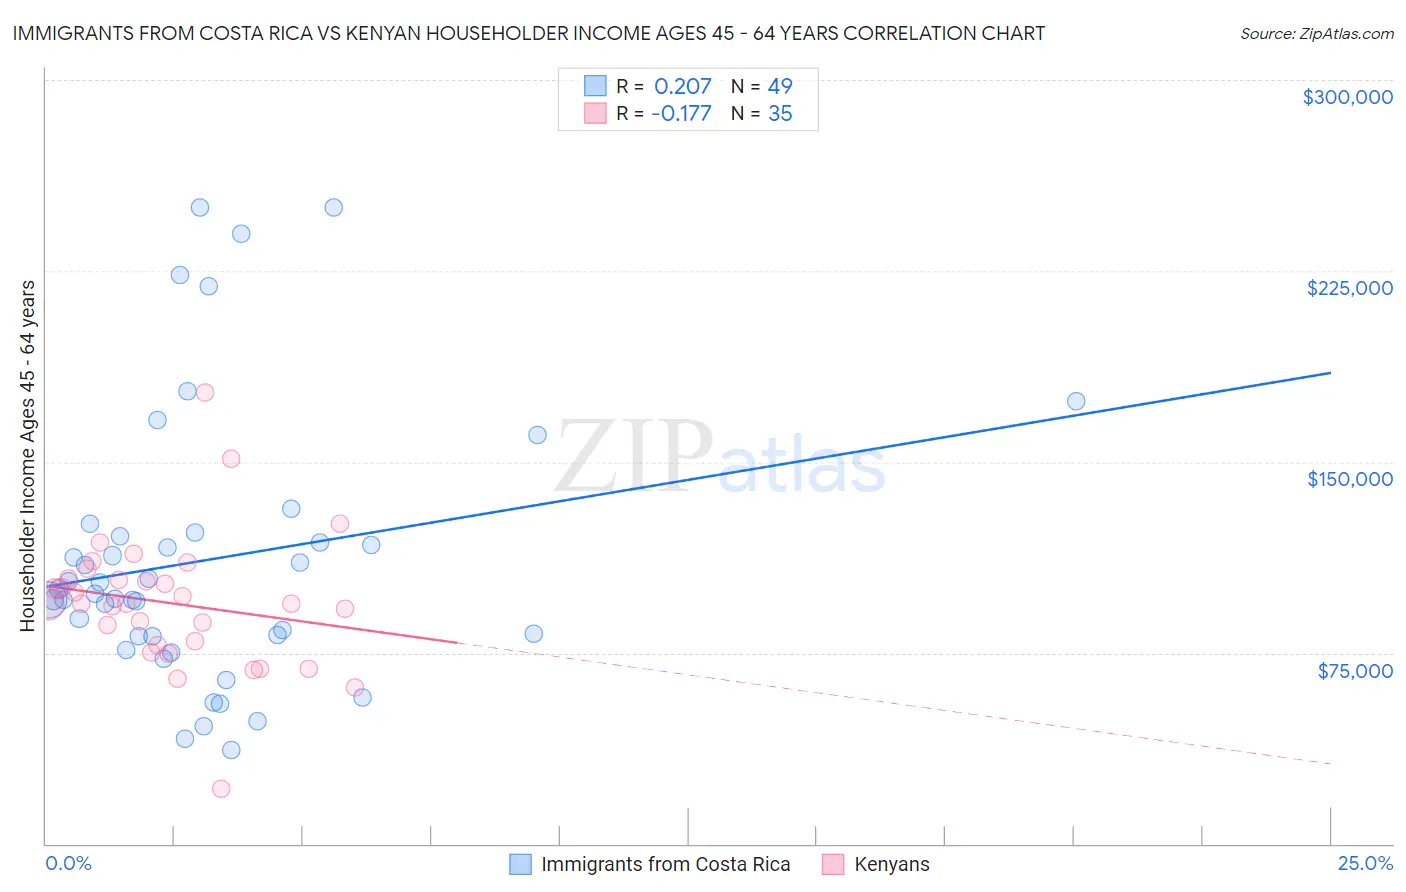
Immigrants from Costa Rica vs Kenyan Householder Income Ages 45 - 64 years Correlation Chart
The statistical analysis conducted on geographies consisting of 204,163,177 people shows a weak positive correlation between the proportion of Immigrants from Costa Rica and household income with householder between the ages 45 and 64 in the United States with a correlation coefficient (R) of 0.207 and weighted average of $100,141. Similarly, the statistical analysis conducted on geographies consisting of 168,091,431 people shows a poor negative correlation between the proportion of Kenyans and household income with householder between the ages 45 and 64 in the United States with a correlation coefficient (R) of -0.177 and weighted average of $98,970, a difference of 1.2%.
Householder Income Ages 45 - 64 years Correlation Summary
| Measurement | Immigrants from Costa Rica | Kenyan |
| Minimum | $36,667 | $21,397 |
| Maximum | $250,001 | $177,411 |
| Range | $213,334 | $156,014 |
| Mean | $111,542 | $94,546 |
| Median | $98,012 | $94,444 |
| Interquartile 25% (IQ1) | $81,355 | $77,946 |
| Interquartile 75% (IQ3) | $121,642 | $104,327 |
| Interquartile Range (IQR) | $40,287 | $26,381 |
| Standard Deviation (Sample) | $53,037 | $26,525 |
| Standard Deviation (Population) | $52,493 | $26,144 |
Demographics Similar to Immigrants from Costa Rica and Kenyans by Householder Income Ages 45 - 64 years
In terms of householder income ages 45 - 64 years, the demographic groups most similar to Immigrants from Costa Rica are Moroccan ($100,138, a difference of 0.0%), Immigrants from Cameroon ($100,084, a difference of 0.060%), German ($100,224, a difference of 0.080%), Belgian ($100,060, a difference of 0.080%), and Aleut ($100,052, a difference of 0.090%). Similarly, the demographic groups most similar to Kenyans are Celtic ($98,896, a difference of 0.070%), French Canadian ($99,093, a difference of 0.12%), Immigrants from South America ($99,126, a difference of 0.16%), Hawaiian ($98,778, a difference of 0.19%), and Immigrants from Portugal ($99,203, a difference of 0.24%).
| Demographics | Rating | Rank | Householder Income Ages 45 - 64 years |
| Alsatians | 51.4 /100 | #173 | Average $100,435 |
| Welsh | 50.0 /100 | #174 | Average $100,322 |
| Germans | 48.8 /100 | #175 | Average $100,224 |
| Immigrants | Costa Rica | 47.7 /100 | #176 | Average $100,141 |
| Moroccans | 47.7 /100 | #177 | Average $100,138 |
| Immigrants | Cameroon | 47.0 /100 | #178 | Average $100,084 |
| Belgians | 46.7 /100 | #179 | Average $100,060 |
| Aleuts | 46.6 /100 | #180 | Average $100,052 |
| Immigrants | Immigrants | 45.3 /100 | #181 | Average $99,943 |
| Finns | 44.8 /100 | #182 | Average $99,904 |
| Spaniards | 44.6 /100 | #183 | Average $99,889 |
| French | 43.8 /100 | #184 | Average $99,824 |
| Colombians | 43.2 /100 | #185 | Average $99,772 |
| Dutch | 41.7 /100 | #186 | Average $99,650 |
| Iraqis | 38.5 /100 | #187 | Fair $99,387 |
| Immigrants | Portugal | 36.3 /100 | #188 | Fair $99,203 |
| Immigrants | South America | 35.4 /100 | #189 | Fair $99,126 |
| French Canadians | 35.1 /100 | #190 | Fair $99,093 |
| Kenyans | 33.7 /100 | #191 | Fair $98,970 |
| Celtics | 32.9 /100 | #192 | Fair $98,896 |
| Hawaiians | 31.6 /100 | #193 | Fair $98,778 |