Danish vs Choctaw Householder Income Ages 25 - 44 years
COMPARE
Danish
Choctaw
Householder Income Ages 25 - 44 years
Householder Income Ages 25 - 44 years Comparison
Danes
Choctaw
$97,221
HOUSEHOLDER INCOME AGES 25 - 44 YEARS
81.3/ 100
METRIC RATING
142nd/ 347
METRIC RANK
$78,168
HOUSEHOLDER INCOME AGES 25 - 44 YEARS
0.0/ 100
METRIC RATING
320th/ 347
METRIC RANK
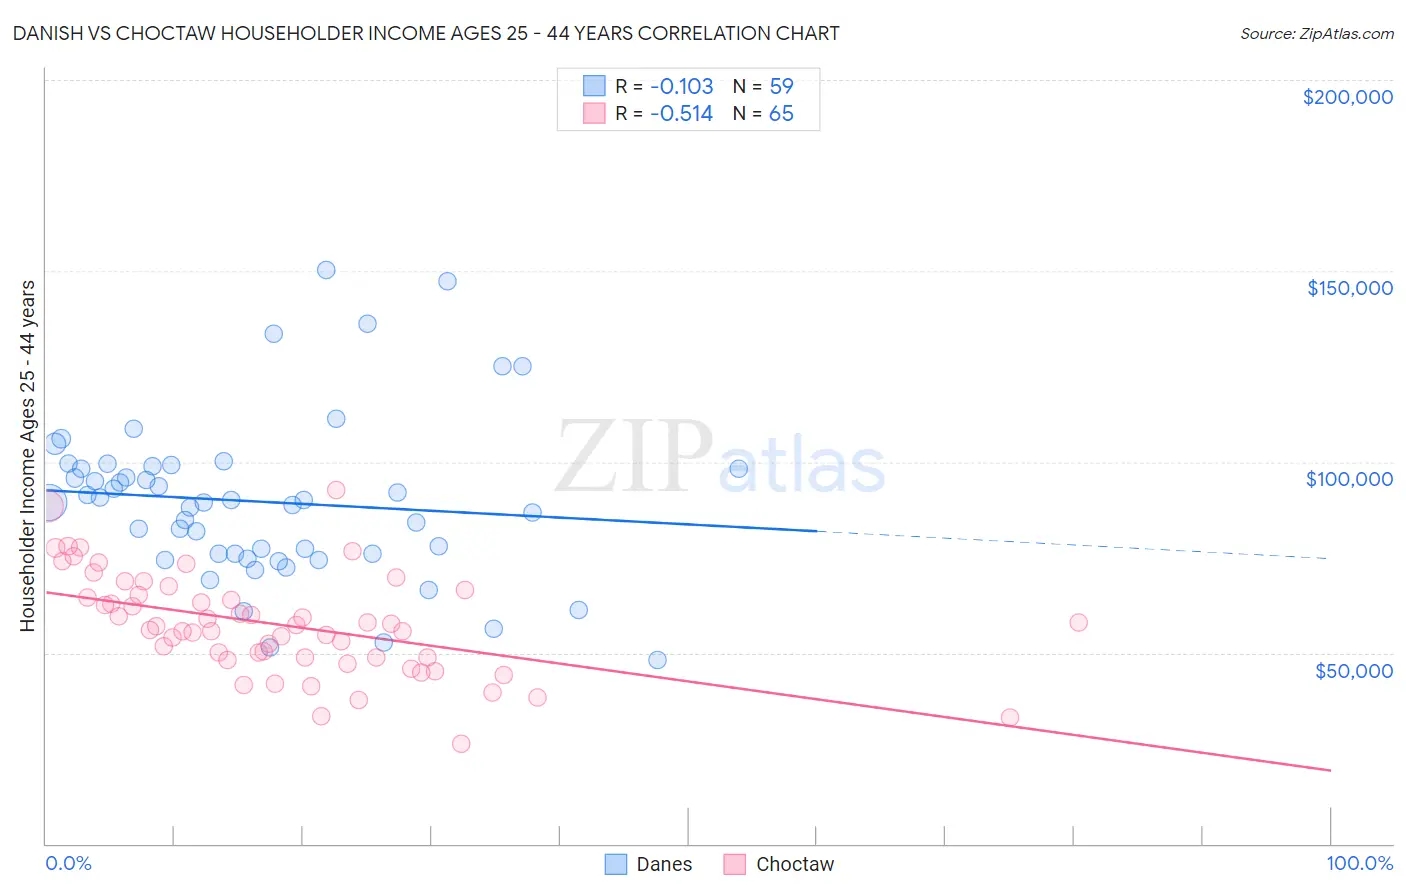
Danish vs Choctaw Householder Income Ages 25 - 44 years Correlation Chart
The statistical analysis conducted on geographies consisting of 471,956,523 people shows a poor negative correlation between the proportion of Danes and household income with householder between the ages 25 and 44 in the United States with a correlation coefficient (R) of -0.103 and weighted average of $97,221. Similarly, the statistical analysis conducted on geographies consisting of 269,000,515 people shows a substantial negative correlation between the proportion of Choctaw and household income with householder between the ages 25 and 44 in the United States with a correlation coefficient (R) of -0.514 and weighted average of $78,168, a difference of 24.4%.
Householder Income Ages 25 - 44 years Correlation Summary
| Measurement | Danish | Choctaw |
| Minimum | $48,125 | $26,250 |
| Maximum | $150,222 | $92,500 |
| Range | $102,097 | $66,250 |
| Mean | $89,539 | $57,418 |
| Median | $89,288 | $56,972 |
| Interquartile 25% (IQ1) | $75,783 | $48,750 |
| Interquartile 75% (IQ3) | $98,883 | $65,678 |
| Interquartile Range (IQR) | $23,100 | $16,928 |
| Standard Deviation (Sample) | $21,492 | $13,252 |
| Standard Deviation (Population) | $21,309 | $13,150 |
Similar Demographics by Householder Income Ages 25 - 44 years
Demographics Similar to Danes by Householder Income Ages 25 - 44 years
In terms of householder income ages 25 - 44 years, the demographic groups most similar to Danes are Luxembourger ($97,237, a difference of 0.020%), Immigrants from Jordan ($97,185, a difference of 0.040%), Immigrants from Chile ($97,159, a difference of 0.060%), Immigrants from Morocco ($97,305, a difference of 0.090%), and Immigrants from Peru ($97,329, a difference of 0.11%).
| Demographics | Rating | Rank | Householder Income Ages 25 - 44 years |
| Immigrants | Oceania | 84.5 /100 | #135 | Excellent $97,623 |
| Hungarians | 83.9 /100 | #136 | Excellent $97,544 |
| Lebanese | 82.3 /100 | #137 | Excellent $97,339 |
| Arabs | 82.3 /100 | #138 | Excellent $97,336 |
| Immigrants | Peru | 82.2 /100 | #139 | Excellent $97,329 |
| Immigrants | Morocco | 82.0 /100 | #140 | Excellent $97,305 |
| Luxembourgers | 81.5 /100 | #141 | Excellent $97,237 |
| Danes | 81.3 /100 | #142 | Excellent $97,221 |
| Immigrants | Jordan | 81.0 /100 | #143 | Excellent $97,185 |
| Immigrants | Chile | 80.8 /100 | #144 | Excellent $97,159 |
| Norwegians | 78.2 /100 | #145 | Good $96,866 |
| Ethiopians | 77.8 /100 | #146 | Good $96,824 |
| Immigrants | Syria | 77.4 /100 | #147 | Good $96,789 |
| Irish | 76.9 /100 | #148 | Good $96,730 |
| Basques | 76.6 /100 | #149 | Good $96,709 |
Demographics Similar to Choctaw by Householder Income Ages 25 - 44 years
In terms of householder income ages 25 - 44 years, the demographic groups most similar to Choctaw are Immigrants from Zaire ($78,045, a difference of 0.16%), Chickasaw ($77,929, a difference of 0.31%), Honduran ($78,540, a difference of 0.48%), Immigrants from Mexico ($78,809, a difference of 0.82%), and U.S. Virgin Islander ($78,911, a difference of 0.95%).
| Demographics | Rating | Rank | Householder Income Ages 25 - 44 years |
| Menominee | 0.0 /100 | #313 | Tragic $79,358 |
| Cheyenne | 0.0 /100 | #314 | Tragic $79,152 |
| Ottawa | 0.0 /100 | #315 | Tragic $79,012 |
| Africans | 0.0 /100 | #316 | Tragic $78,986 |
| U.S. Virgin Islanders | 0.0 /100 | #317 | Tragic $78,911 |
| Immigrants | Mexico | 0.0 /100 | #318 | Tragic $78,809 |
| Hondurans | 0.0 /100 | #319 | Tragic $78,540 |
| Choctaw | 0.0 /100 | #320 | Tragic $78,168 |
| Immigrants | Zaire | 0.0 /100 | #321 | Tragic $78,045 |
| Chickasaw | 0.0 /100 | #322 | Tragic $77,929 |
| Immigrants | Honduras | 0.0 /100 | #323 | Tragic $77,328 |
| Dutch West Indians | 0.0 /100 | #324 | Tragic $77,260 |
| Sioux | 0.0 /100 | #325 | Tragic $77,089 |
| Houma | 0.0 /100 | #326 | Tragic $77,044 |
| Immigrants | Bahamas | 0.0 /100 | #327 | Tragic $76,910 |