Alsatian vs Choctaw Householder Income Ages 25 - 44 years
COMPARE
Alsatian
Choctaw
Householder Income Ages 25 - 44 years
Householder Income Ages 25 - 44 years Comparison
Alsatians
Choctaw
$95,059
HOUSEHOLDER INCOME AGES 25 - 44 YEARS
56.8/ 100
METRIC RATING
168th/ 347
METRIC RANK
$78,168
HOUSEHOLDER INCOME AGES 25 - 44 YEARS
0.0/ 100
METRIC RATING
320th/ 347
METRIC RANK
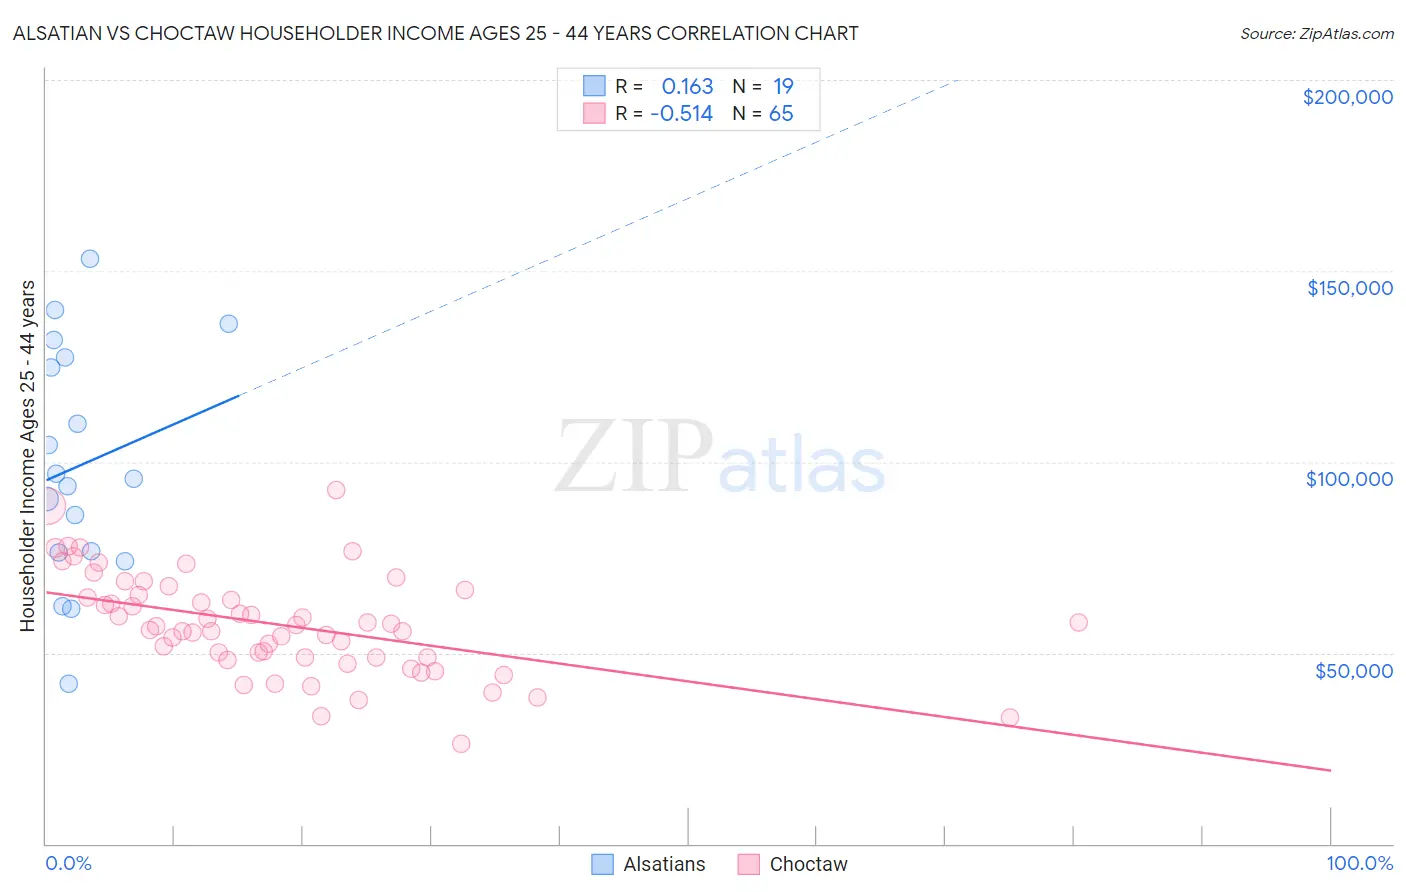
Alsatian vs Choctaw Householder Income Ages 25 - 44 years Correlation Chart
The statistical analysis conducted on geographies consisting of 82,595,947 people shows a poor positive correlation between the proportion of Alsatians and household income with householder between the ages 25 and 44 in the United States with a correlation coefficient (R) of 0.163 and weighted average of $95,059. Similarly, the statistical analysis conducted on geographies consisting of 269,000,515 people shows a substantial negative correlation between the proportion of Choctaw and household income with householder between the ages 25 and 44 in the United States with a correlation coefficient (R) of -0.514 and weighted average of $78,168, a difference of 21.6%.
Householder Income Ages 25 - 44 years Correlation Summary
| Measurement | Alsatian | Choctaw |
| Minimum | $42,026 | $26,250 |
| Maximum | $153,077 | $92,500 |
| Range | $111,051 | $66,250 |
| Mean | $99,110 | $57,418 |
| Median | $95,529 | $56,972 |
| Interquartile 25% (IQ1) | $76,336 | $48,750 |
| Interquartile 75% (IQ3) | $127,229 | $65,678 |
| Interquartile Range (IQR) | $50,893 | $16,928 |
| Standard Deviation (Sample) | $30,381 | $13,252 |
| Standard Deviation (Population) | $29,570 | $13,150 |
Similar Demographics by Householder Income Ages 25 - 44 years
Demographics Similar to Alsatians by Householder Income Ages 25 - 44 years
In terms of householder income ages 25 - 44 years, the demographic groups most similar to Alsatians are Native Hawaiian ($95,058, a difference of 0.0%), Czechoslovakian ($95,070, a difference of 0.010%), Slovak ($95,032, a difference of 0.030%), Immigrants from Armenia ($94,867, a difference of 0.20%), and Immigrants from Ethiopia ($95,256, a difference of 0.21%).
| Demographics | Rating | Rank | Householder Income Ages 25 - 44 years |
| Immigrants | Portugal | 62.8 /100 | #161 | Good $95,512 |
| Swiss | 62.8 /100 | #162 | Good $95,511 |
| Immigrants | Saudi Arabia | 62.0 /100 | #163 | Good $95,450 |
| South Americans | 60.9 /100 | #164 | Good $95,362 |
| Immigrants | Nepal | 60.3 /100 | #165 | Good $95,322 |
| Immigrants | Ethiopia | 59.5 /100 | #166 | Average $95,256 |
| Czechoslovakians | 57.0 /100 | #167 | Average $95,070 |
| Alsatians | 56.8 /100 | #168 | Average $95,059 |
| Native Hawaiians | 56.8 /100 | #169 | Average $95,058 |
| Slovaks | 56.4 /100 | #170 | Average $95,032 |
| Immigrants | Armenia | 54.2 /100 | #171 | Average $94,867 |
| Scottish | 50.8 /100 | #172 | Average $94,622 |
| Finns | 50.6 /100 | #173 | Average $94,610 |
| Colombians | 50.0 /100 | #174 | Average $94,565 |
| English | 48.1 /100 | #175 | Average $94,429 |
Demographics Similar to Choctaw by Householder Income Ages 25 - 44 years
In terms of householder income ages 25 - 44 years, the demographic groups most similar to Choctaw are Immigrants from Zaire ($78,045, a difference of 0.16%), Chickasaw ($77,929, a difference of 0.31%), Honduran ($78,540, a difference of 0.48%), Immigrants from Mexico ($78,809, a difference of 0.82%), and U.S. Virgin Islander ($78,911, a difference of 0.95%).
| Demographics | Rating | Rank | Householder Income Ages 25 - 44 years |
| Menominee | 0.0 /100 | #313 | Tragic $79,358 |
| Cheyenne | 0.0 /100 | #314 | Tragic $79,152 |
| Ottawa | 0.0 /100 | #315 | Tragic $79,012 |
| Africans | 0.0 /100 | #316 | Tragic $78,986 |
| U.S. Virgin Islanders | 0.0 /100 | #317 | Tragic $78,911 |
| Immigrants | Mexico | 0.0 /100 | #318 | Tragic $78,809 |
| Hondurans | 0.0 /100 | #319 | Tragic $78,540 |
| Choctaw | 0.0 /100 | #320 | Tragic $78,168 |
| Immigrants | Zaire | 0.0 /100 | #321 | Tragic $78,045 |
| Chickasaw | 0.0 /100 | #322 | Tragic $77,929 |
| Immigrants | Honduras | 0.0 /100 | #323 | Tragic $77,328 |
| Dutch West Indians | 0.0 /100 | #324 | Tragic $77,260 |
| Sioux | 0.0 /100 | #325 | Tragic $77,089 |
| Houma | 0.0 /100 | #326 | Tragic $77,044 |
| Immigrants | Bahamas | 0.0 /100 | #327 | Tragic $76,910 |