Nonimmigrants vs Moroccan Householder Income Ages 25 - 44 years
COMPARE
Nonimmigrants
Moroccan
Householder Income Ages 25 - 44 years
Householder Income Ages 25 - 44 years Comparison
Nonimmigrants
Moroccans
$88,301
HOUSEHOLDER INCOME AGES 25 - 44 YEARS
3.0/ 100
METRIC RATING
232nd/ 347
METRIC RANK
$96,117
HOUSEHOLDER INCOME AGES 25 - 44 YEARS
70.3/ 100
METRIC RATING
155th/ 347
METRIC RANK
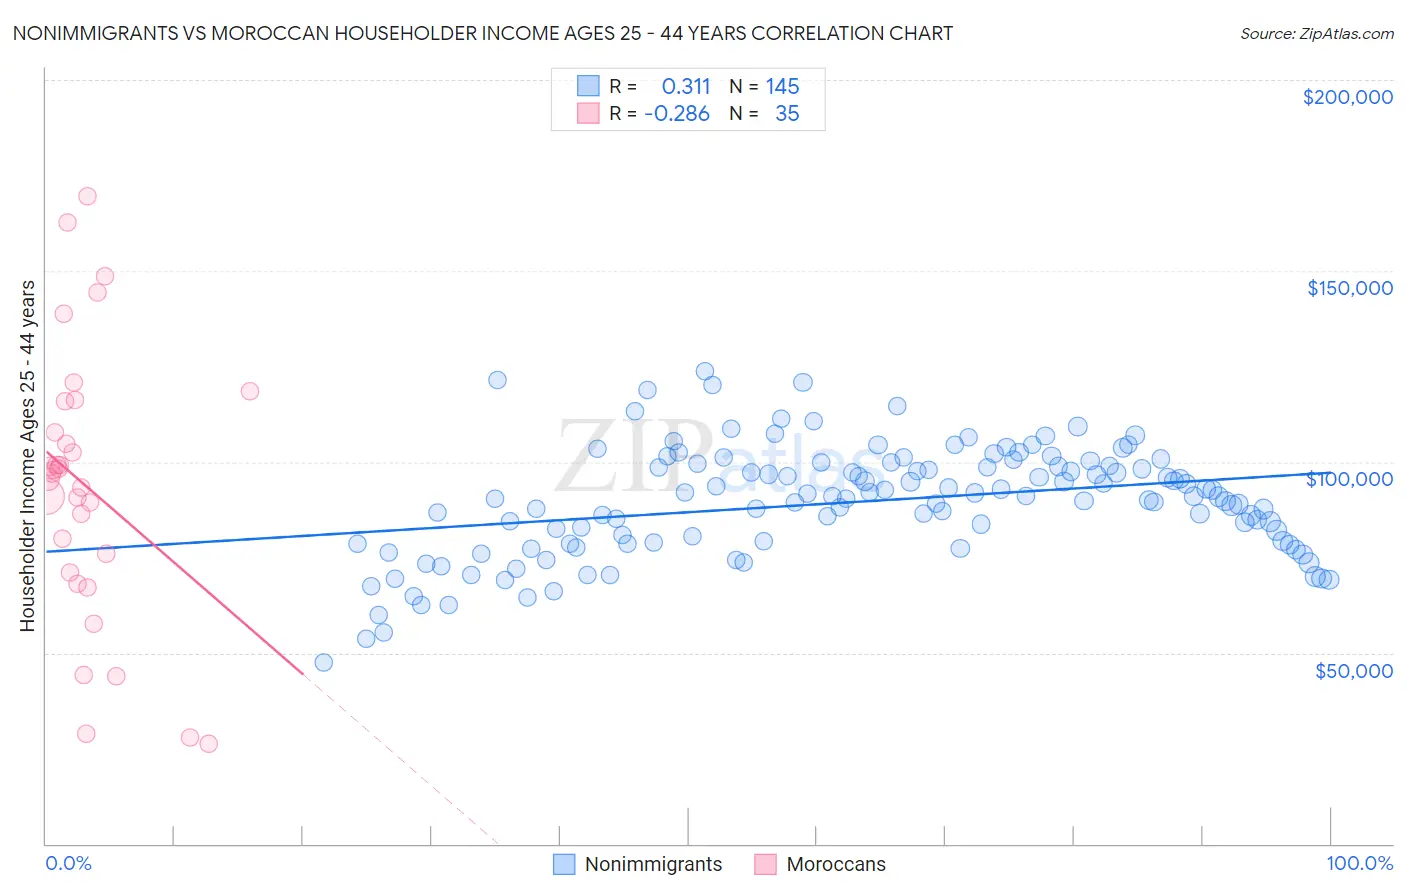
Nonimmigrants vs Moroccan Householder Income Ages 25 - 44 years Correlation Chart
The statistical analysis conducted on geographies consisting of 576,019,560 people shows a mild positive correlation between the proportion of Nonimmigrants and household income with householder between the ages 25 and 44 in the United States with a correlation coefficient (R) of 0.311 and weighted average of $88,301. Similarly, the statistical analysis conducted on geographies consisting of 201,535,372 people shows a weak negative correlation between the proportion of Moroccans and household income with householder between the ages 25 and 44 in the United States with a correlation coefficient (R) of -0.286 and weighted average of $96,117, a difference of 8.8%.
Householder Income Ages 25 - 44 years Correlation Summary
| Measurement | Nonimmigrants | Moroccan |
| Minimum | $47,510 | $26,250 |
| Maximum | $123,721 | $169,563 |
| Range | $76,211 | $143,313 |
| Mean | $89,568 | $93,636 |
| Median | $91,026 | $96,963 |
| Interquartile 25% (IQ1) | $78,698 | $70,962 |
| Interquartile 75% (IQ3) | $99,239 | $115,732 |
| Interquartile Range (IQR) | $20,541 | $44,770 |
| Standard Deviation (Sample) | $14,473 | $35,487 |
| Standard Deviation (Population) | $14,423 | $34,976 |
Similar Demographics by Householder Income Ages 25 - 44 years
Demographics Similar to Nonimmigrants by Householder Income Ages 25 - 44 years
In terms of householder income ages 25 - 44 years, the demographic groups most similar to Nonimmigrants are Immigrants from Grenada ($88,311, a difference of 0.010%), Malaysian ($88,291, a difference of 0.010%), Venezuelan ($88,232, a difference of 0.080%), Bermudan ($88,231, a difference of 0.080%), and Immigrants from Cameroon ($88,214, a difference of 0.10%).
| Demographics | Rating | Rank | Householder Income Ages 25 - 44 years |
| Immigrants | Panama | 5.5 /100 | #225 | Tragic $89,451 |
| Immigrants | Iraq | 5.5 /100 | #226 | Tragic $89,444 |
| Immigrants | St. Vincent and the Grenadines | 4.1 /100 | #227 | Tragic $88,888 |
| Immigrants | Bosnia and Herzegovina | 4.0 /100 | #228 | Tragic $88,819 |
| Immigrants | Barbados | 3.7 /100 | #229 | Tragic $88,687 |
| Alaskan Athabascans | 3.3 /100 | #230 | Tragic $88,446 |
| Immigrants | Grenada | 3.0 /100 | #231 | Tragic $88,311 |
| Immigrants | Nonimmigrants | 3.0 /100 | #232 | Tragic $88,301 |
| Malaysians | 3.0 /100 | #233 | Tragic $88,291 |
| Venezuelans | 2.9 /100 | #234 | Tragic $88,232 |
| Bermudans | 2.9 /100 | #235 | Tragic $88,231 |
| Immigrants | Cameroon | 2.9 /100 | #236 | Tragic $88,214 |
| Salvadorans | 2.8 /100 | #237 | Tragic $88,198 |
| Alaska Natives | 2.6 /100 | #238 | Tragic $88,018 |
| Immigrants | Ghana | 2.2 /100 | #239 | Tragic $87,760 |
Demographics Similar to Moroccans by Householder Income Ages 25 - 44 years
In terms of householder income ages 25 - 44 years, the demographic groups most similar to Moroccans are Immigrants from Germany ($95,913, a difference of 0.21%), Slavic ($96,377, a difference of 0.27%), Slovene ($96,439, a difference of 0.33%), South American Indian ($96,497, a difference of 0.40%), and Czech ($96,525, a difference of 0.42%).
| Demographics | Rating | Rank | Householder Income Ages 25 - 44 years |
| Irish | 76.9 /100 | #148 | Good $96,730 |
| Basques | 76.6 /100 | #149 | Good $96,709 |
| Ugandans | 76.2 /100 | #150 | Good $96,667 |
| Czechs | 74.8 /100 | #151 | Good $96,525 |
| South American Indians | 74.5 /100 | #152 | Good $96,497 |
| Slovenes | 73.9 /100 | #153 | Good $96,439 |
| Slavs | 73.2 /100 | #154 | Good $96,377 |
| Moroccans | 70.3 /100 | #155 | Good $96,117 |
| Immigrants | Germany | 67.9 /100 | #156 | Good $95,913 |
| Immigrants | Uganda | 65.2 /100 | #157 | Good $95,698 |
| Scandinavians | 63.9 /100 | #158 | Good $95,596 |
| Costa Ricans | 63.5 /100 | #159 | Good $95,565 |
| Icelanders | 63.4 /100 | #160 | Good $95,560 |
| Immigrants | Portugal | 62.8 /100 | #161 | Good $95,512 |
| Swiss | 62.8 /100 | #162 | Good $95,511 |