Senegalese vs Bulgarian Median Family Income
COMPARE
Senegalese
Bulgarian
Median Family Income
Median Family Income Comparison
Senegalese
Bulgarians
$91,475
MEDIAN FAMILY INCOME
0.3/ 100
METRIC RATING
264th/ 347
METRIC RANK
$117,818
MEDIAN FAMILY INCOME
100.0/ 100
METRIC RATING
43rd/ 347
METRIC RANK
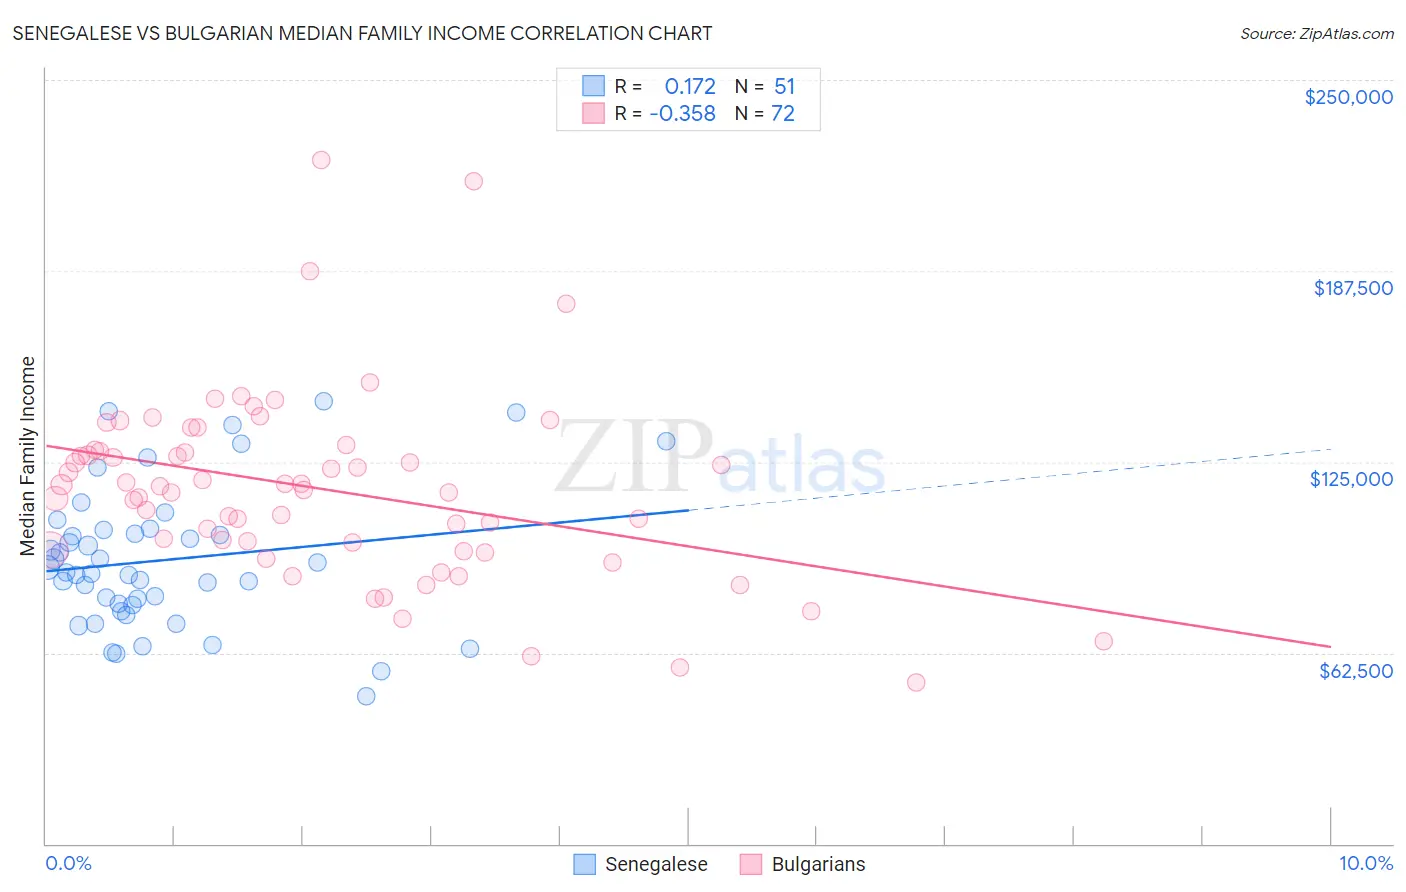
Senegalese vs Bulgarian Median Family Income Correlation Chart
The statistical analysis conducted on geographies consisting of 78,068,441 people shows a poor positive correlation between the proportion of Senegalese and median family income in the United States with a correlation coefficient (R) of 0.172 and weighted average of $91,475. Similarly, the statistical analysis conducted on geographies consisting of 205,529,266 people shows a mild negative correlation between the proportion of Bulgarians and median family income in the United States with a correlation coefficient (R) of -0.358 and weighted average of $117,818, a difference of 28.8%.
Median Family Income Correlation Summary
| Measurement | Senegalese | Bulgarian |
| Minimum | $48,125 | $52,778 |
| Maximum | $145,000 | $223,917 |
| Range | $96,875 | $171,139 |
| Mean | $92,900 | $116,110 |
| Median | $88,669 | $116,274 |
| Interquartile 25% (IQ1) | $78,308 | $97,368 |
| Interquartile 75% (IQ3) | $102,554 | $128,713 |
| Interquartile Range (IQR) | $24,246 | $31,345 |
| Standard Deviation (Sample) | $22,975 | $30,846 |
| Standard Deviation (Population) | $22,749 | $30,631 |
Similar Demographics by Median Family Income
Demographics Similar to Senegalese by Median Family Income
In terms of median family income, the demographic groups most similar to Senegalese are Immigrants from West Indies ($91,588, a difference of 0.12%), Hmong ($91,296, a difference of 0.20%), Liberian ($91,722, a difference of 0.27%), Inupiat ($91,730, a difference of 0.28%), and Pennsylvania German ($91,763, a difference of 0.31%).
| Demographics | Rating | Rank | Median Family Income |
| Americans | 0.4 /100 | #257 | Tragic $92,096 |
| Osage | 0.4 /100 | #258 | Tragic $91,926 |
| Cape Verdeans | 0.4 /100 | #259 | Tragic $91,848 |
| Pennsylvania Germans | 0.4 /100 | #260 | Tragic $91,763 |
| Inupiat | 0.4 /100 | #261 | Tragic $91,730 |
| Liberians | 0.4 /100 | #262 | Tragic $91,722 |
| Immigrants | West Indies | 0.3 /100 | #263 | Tragic $91,588 |
| Senegalese | 0.3 /100 | #264 | Tragic $91,475 |
| Hmong | 0.3 /100 | #265 | Tragic $91,296 |
| Central Americans | 0.3 /100 | #266 | Tragic $91,087 |
| Mexican American Indians | 0.2 /100 | #267 | Tragic $90,918 |
| Cree | 0.2 /100 | #268 | Tragic $90,882 |
| Belizeans | 0.2 /100 | #269 | Tragic $90,880 |
| Jamaicans | 0.2 /100 | #270 | Tragic $90,581 |
| Iroquois | 0.2 /100 | #271 | Tragic $90,543 |
Demographics Similar to Bulgarians by Median Family Income
In terms of median family income, the demographic groups most similar to Bulgarians are Cambodian ($117,780, a difference of 0.030%), Immigrants from Bolivia ($117,912, a difference of 0.080%), Estonian ($118,013, a difference of 0.17%), Immigrants from Lithuania ($118,053, a difference of 0.20%), and Immigrants from Asia ($118,291, a difference of 0.40%).
| Demographics | Rating | Rank | Median Family Income |
| Israelis | 100.0 /100 | #36 | Exceptional $118,577 |
| Australians | 100.0 /100 | #37 | Exceptional $118,440 |
| Immigrants | Turkey | 100.0 /100 | #38 | Exceptional $118,325 |
| Immigrants | Asia | 100.0 /100 | #39 | Exceptional $118,291 |
| Immigrants | Lithuania | 100.0 /100 | #40 | Exceptional $118,053 |
| Estonians | 100.0 /100 | #41 | Exceptional $118,013 |
| Immigrants | Bolivia | 100.0 /100 | #42 | Exceptional $117,912 |
| Bulgarians | 100.0 /100 | #43 | Exceptional $117,818 |
| Cambodians | 100.0 /100 | #44 | Exceptional $117,780 |
| Immigrants | Greece | 99.9 /100 | #45 | Exceptional $117,344 |
| Immigrants | Russia | 99.9 /100 | #46 | Exceptional $116,942 |
| Immigrants | Austria | 99.9 /100 | #47 | Exceptional $116,830 |
| Immigrants | South Africa | 99.9 /100 | #48 | Exceptional $116,286 |
| Chinese | 99.9 /100 | #49 | Exceptional $116,188 |
| Immigrants | Czechoslovakia | 99.9 /100 | #50 | Exceptional $116,165 |