Senegalese vs Immigrants from Asia Householder Income Ages 45 - 64 years
COMPARE
Senegalese
Immigrants from Asia
Householder Income Ages 45 - 64 years
Householder Income Ages 45 - 64 years Comparison
Senegalese
Immigrants from Asia
$86,897
HOUSEHOLDER INCOME AGES 45 - 64 YEARS
0.1/ 100
METRIC RATING
282nd/ 347
METRIC RANK
$116,566
HOUSEHOLDER INCOME AGES 45 - 64 YEARS
100.0/ 100
METRIC RATING
31st/ 347
METRIC RANK
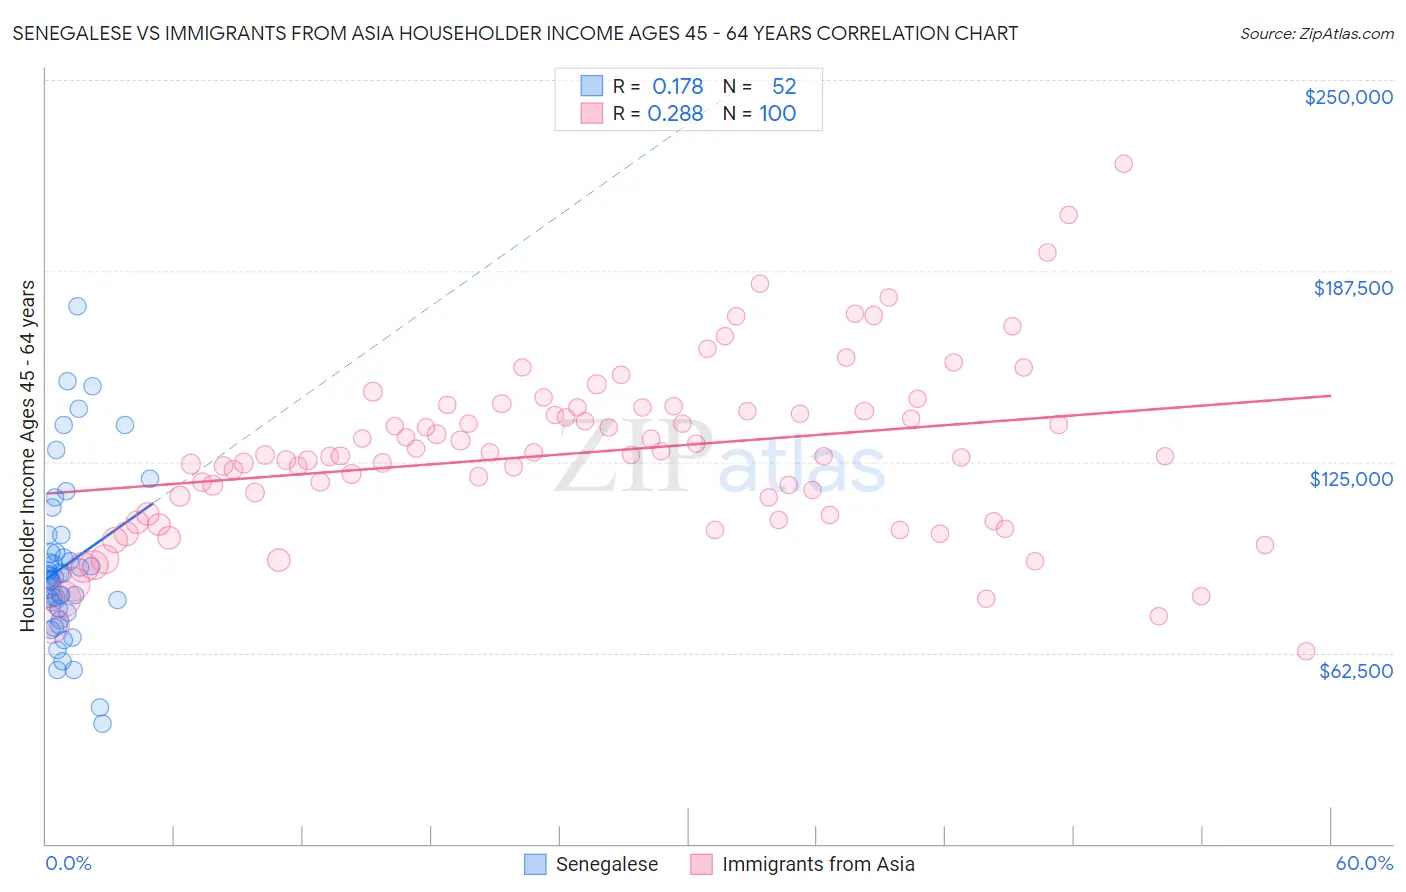
Senegalese vs Immigrants from Asia Householder Income Ages 45 - 64 years Correlation Chart
The statistical analysis conducted on geographies consisting of 78,071,006 people shows a poor positive correlation between the proportion of Senegalese and household income with householder between the ages 45 and 64 in the United States with a correlation coefficient (R) of 0.178 and weighted average of $86,897. Similarly, the statistical analysis conducted on geographies consisting of 546,661,171 people shows a weak positive correlation between the proportion of Immigrants from Asia and household income with householder between the ages 45 and 64 in the United States with a correlation coefficient (R) of 0.288 and weighted average of $116,566, a difference of 34.1%.
Householder Income Ages 45 - 64 years Correlation Summary
| Measurement | Senegalese | Immigrants from Asia |
| Minimum | $39,353 | $62,982 |
| Maximum | $175,761 | $222,452 |
| Range | $136,408 | $159,470 |
| Mean | $91,310 | $128,196 |
| Median | $87,120 | $127,106 |
| Interquartile 25% (IQ1) | $76,238 | $107,795 |
| Interquartile 75% (IQ3) | $98,209 | $142,101 |
| Interquartile Range (IQR) | $21,971 | $34,306 |
| Standard Deviation (Sample) | $27,351 | $28,288 |
| Standard Deviation (Population) | $27,087 | $28,146 |
Similar Demographics by Householder Income Ages 45 - 64 years
Demographics Similar to Senegalese by Householder Income Ages 45 - 64 years
In terms of householder income ages 45 - 64 years, the demographic groups most similar to Senegalese are Yaqui ($86,914, a difference of 0.020%), Mexican ($86,816, a difference of 0.090%), Immigrants from Somalia ($86,987, a difference of 0.10%), Yakama ($86,992, a difference of 0.11%), and Central American Indian ($86,764, a difference of 0.15%).
| Demographics | Rating | Rank | Householder Income Ages 45 - 64 years |
| Immigrants | Belize | 0.1 /100 | #275 | Tragic $87,229 |
| Immigrants | Latin America | 0.1 /100 | #276 | Tragic $87,219 |
| Cree | 0.1 /100 | #277 | Tragic $87,185 |
| Immigrants | Jamaica | 0.1 /100 | #278 | Tragic $87,035 |
| Yakama | 0.1 /100 | #279 | Tragic $86,992 |
| Immigrants | Somalia | 0.1 /100 | #280 | Tragic $86,987 |
| Yaqui | 0.1 /100 | #281 | Tragic $86,914 |
| Senegalese | 0.1 /100 | #282 | Tragic $86,897 |
| Mexicans | 0.1 /100 | #283 | Tragic $86,816 |
| Central American Indians | 0.1 /100 | #284 | Tragic $86,764 |
| Blackfeet | 0.1 /100 | #285 | Tragic $86,595 |
| Immigrants | Guatemala | 0.1 /100 | #286 | Tragic $86,573 |
| Bangladeshis | 0.1 /100 | #287 | Tragic $86,402 |
| Immigrants | St. Vincent and the Grenadines | 0.1 /100 | #288 | Tragic $86,394 |
| Cubans | 0.1 /100 | #289 | Tragic $86,301 |
Demographics Similar to Immigrants from Asia by Householder Income Ages 45 - 64 years
In terms of householder income ages 45 - 64 years, the demographic groups most similar to Immigrants from Asia are Russian ($116,328, a difference of 0.20%), Chinese ($116,156, a difference of 0.35%), Immigrants from Denmark ($116,000, a difference of 0.49%), Latvian ($115,957, a difference of 0.53%), and Immigrants from Switzerland ($115,934, a difference of 0.54%).
| Demographics | Rating | Rank | Householder Income Ages 45 - 64 years |
| Immigrants | Japan | 100.0 /100 | #24 | Exceptional $118,498 |
| Asians | 100.0 /100 | #25 | Exceptional $118,426 |
| Immigrants | Sweden | 100.0 /100 | #26 | Exceptional $118,318 |
| Immigrants | Northern Europe | 100.0 /100 | #27 | Exceptional $117,930 |
| Turks | 100.0 /100 | #28 | Exceptional $117,814 |
| Bhutanese | 100.0 /100 | #29 | Exceptional $117,750 |
| Immigrants | Bolivia | 100.0 /100 | #30 | Exceptional $117,731 |
| Immigrants | Asia | 100.0 /100 | #31 | Exceptional $116,566 |
| Russians | 100.0 /100 | #32 | Exceptional $116,328 |
| Chinese | 100.0 /100 | #33 | Exceptional $116,156 |
| Immigrants | Denmark | 100.0 /100 | #34 | Exceptional $116,000 |
| Latvians | 100.0 /100 | #35 | Exceptional $115,957 |
| Immigrants | Switzerland | 100.0 /100 | #36 | Exceptional $115,934 |
| Maltese | 99.9 /100 | #37 | Exceptional $114,754 |
| Immigrants | Pakistan | 99.9 /100 | #38 | Exceptional $114,434 |