Sioux vs Immigrants from Asia Householder Income Ages 45 - 64 years
COMPARE
Sioux
Immigrants from Asia
Householder Income Ages 45 - 64 years
Householder Income Ages 45 - 64 years Comparison
Sioux
Immigrants from Asia
$81,750
HOUSEHOLDER INCOME AGES 45 - 64 YEARS
0.0/ 100
METRIC RATING
322nd/ 347
METRIC RANK
$116,566
HOUSEHOLDER INCOME AGES 45 - 64 YEARS
100.0/ 100
METRIC RATING
31st/ 347
METRIC RANK
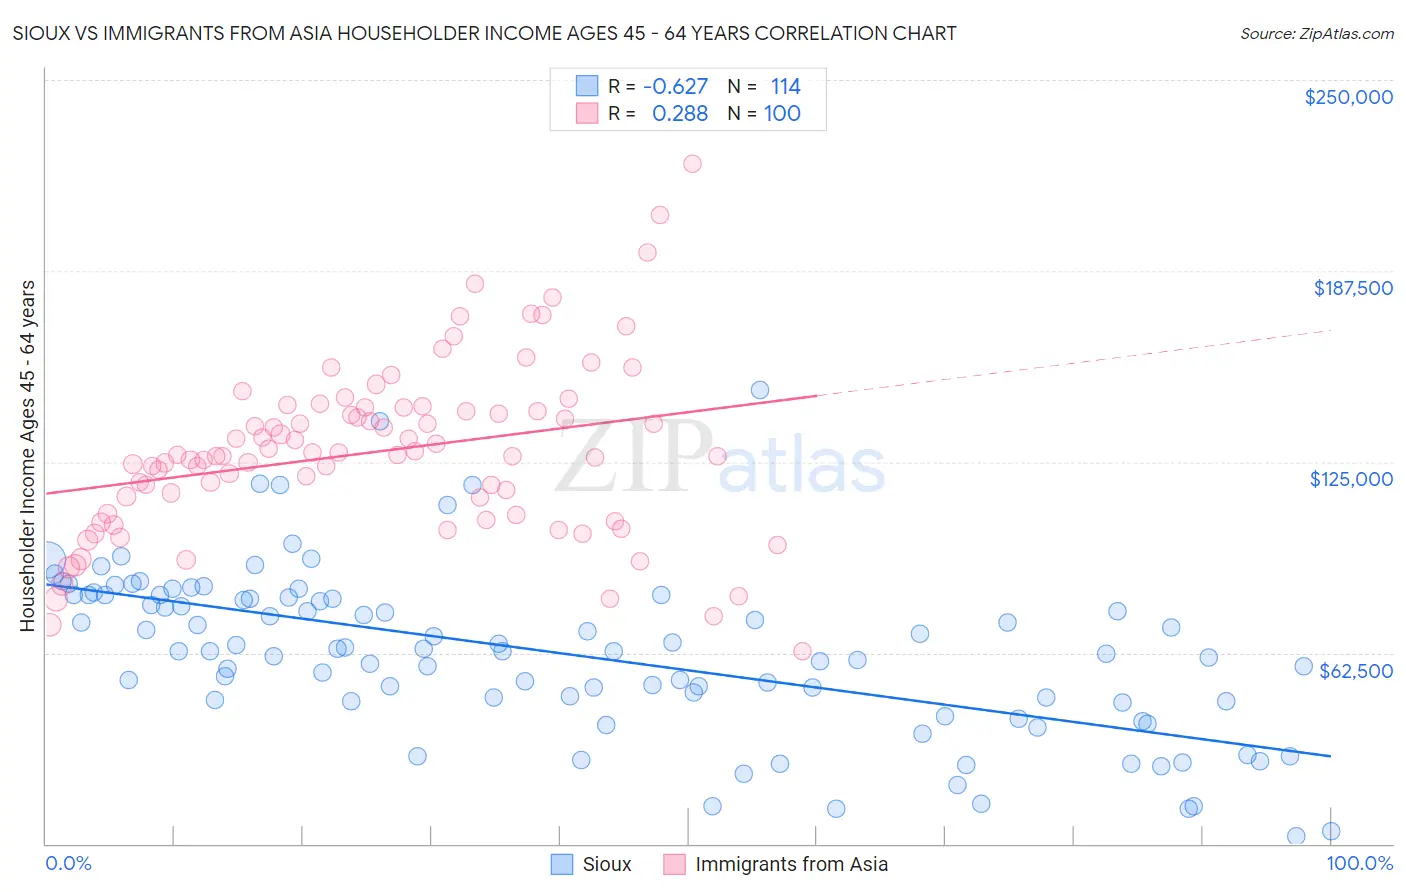
Sioux vs Immigrants from Asia Householder Income Ages 45 - 64 years Correlation Chart
The statistical analysis conducted on geographies consisting of 233,839,839 people shows a significant negative correlation between the proportion of Sioux and household income with householder between the ages 45 and 64 in the United States with a correlation coefficient (R) of -0.627 and weighted average of $81,750. Similarly, the statistical analysis conducted on geographies consisting of 546,661,171 people shows a weak positive correlation between the proportion of Immigrants from Asia and household income with householder between the ages 45 and 64 in the United States with a correlation coefficient (R) of 0.288 and weighted average of $116,566, a difference of 42.6%.
Householder Income Ages 45 - 64 years Correlation Summary
| Measurement | Sioux | Immigrants from Asia |
| Minimum | $2,499 | $62,982 |
| Maximum | $148,571 | $222,452 |
| Range | $146,072 | $159,470 |
| Mean | $62,223 | $128,196 |
| Median | $63,145 | $127,106 |
| Interquartile 25% (IQ1) | $46,523 | $107,795 |
| Interquartile 75% (IQ3) | $80,556 | $142,101 |
| Interquartile Range (IQR) | $34,033 | $34,306 |
| Standard Deviation (Sample) | $27,229 | $28,288 |
| Standard Deviation (Population) | $27,109 | $28,146 |
Similar Demographics by Householder Income Ages 45 - 64 years
Demographics Similar to Sioux by Householder Income Ages 45 - 64 years
In terms of householder income ages 45 - 64 years, the demographic groups most similar to Sioux are Bahamian ($81,369, a difference of 0.47%), Yuman ($82,139, a difference of 0.48%), Apache ($82,184, a difference of 0.53%), Chickasaw ($82,193, a difference of 0.54%), and Choctaw ($82,287, a difference of 0.66%).
| Demographics | Rating | Rank | Householder Income Ages 45 - 64 years |
| Paiute | 0.0 /100 | #315 | Tragic $82,629 |
| Immigrants | Caribbean | 0.0 /100 | #316 | Tragic $82,513 |
| Colville | 0.0 /100 | #317 | Tragic $82,474 |
| Choctaw | 0.0 /100 | #318 | Tragic $82,287 |
| Chickasaw | 0.0 /100 | #319 | Tragic $82,193 |
| Apache | 0.0 /100 | #320 | Tragic $82,184 |
| Yuman | 0.0 /100 | #321 | Tragic $82,139 |
| Sioux | 0.0 /100 | #322 | Tragic $81,750 |
| Bahamians | 0.0 /100 | #323 | Tragic $81,369 |
| Yup'ik | 0.0 /100 | #324 | Tragic $81,000 |
| Immigrants | Cuba | 0.0 /100 | #325 | Tragic $80,662 |
| Dominicans | 0.0 /100 | #326 | Tragic $80,623 |
| Seminole | 0.0 /100 | #327 | Tragic $80,077 |
| Natives/Alaskans | 0.0 /100 | #328 | Tragic $79,816 |
| Dutch West Indians | 0.0 /100 | #329 | Tragic $79,171 |
Demographics Similar to Immigrants from Asia by Householder Income Ages 45 - 64 years
In terms of householder income ages 45 - 64 years, the demographic groups most similar to Immigrants from Asia are Russian ($116,328, a difference of 0.20%), Chinese ($116,156, a difference of 0.35%), Immigrants from Denmark ($116,000, a difference of 0.49%), Latvian ($115,957, a difference of 0.53%), and Immigrants from Switzerland ($115,934, a difference of 0.54%).
| Demographics | Rating | Rank | Householder Income Ages 45 - 64 years |
| Immigrants | Japan | 100.0 /100 | #24 | Exceptional $118,498 |
| Asians | 100.0 /100 | #25 | Exceptional $118,426 |
| Immigrants | Sweden | 100.0 /100 | #26 | Exceptional $118,318 |
| Immigrants | Northern Europe | 100.0 /100 | #27 | Exceptional $117,930 |
| Turks | 100.0 /100 | #28 | Exceptional $117,814 |
| Bhutanese | 100.0 /100 | #29 | Exceptional $117,750 |
| Immigrants | Bolivia | 100.0 /100 | #30 | Exceptional $117,731 |
| Immigrants | Asia | 100.0 /100 | #31 | Exceptional $116,566 |
| Russians | 100.0 /100 | #32 | Exceptional $116,328 |
| Chinese | 100.0 /100 | #33 | Exceptional $116,156 |
| Immigrants | Denmark | 100.0 /100 | #34 | Exceptional $116,000 |
| Latvians | 100.0 /100 | #35 | Exceptional $115,957 |
| Immigrants | Switzerland | 100.0 /100 | #36 | Exceptional $115,934 |
| Maltese | 99.9 /100 | #37 | Exceptional $114,754 |
| Immigrants | Pakistan | 99.9 /100 | #38 | Exceptional $114,434 |